Optimize Data Center Fabric Performance
From business-critical apps to AI workloads, seamless user experience starts with the network.
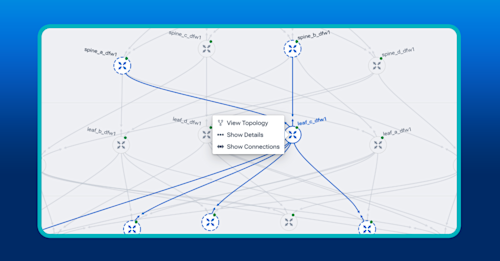
See what other tools miss — microburst events, traffic paths, overlays, and everything in between.
Make smarter routing and capacity decisions with real-time traffic visibility across your fabric.
Pinpoint performance issues across the entire network fabric, not just traditional bottlenecks.
Real-time visibility into data center fabric
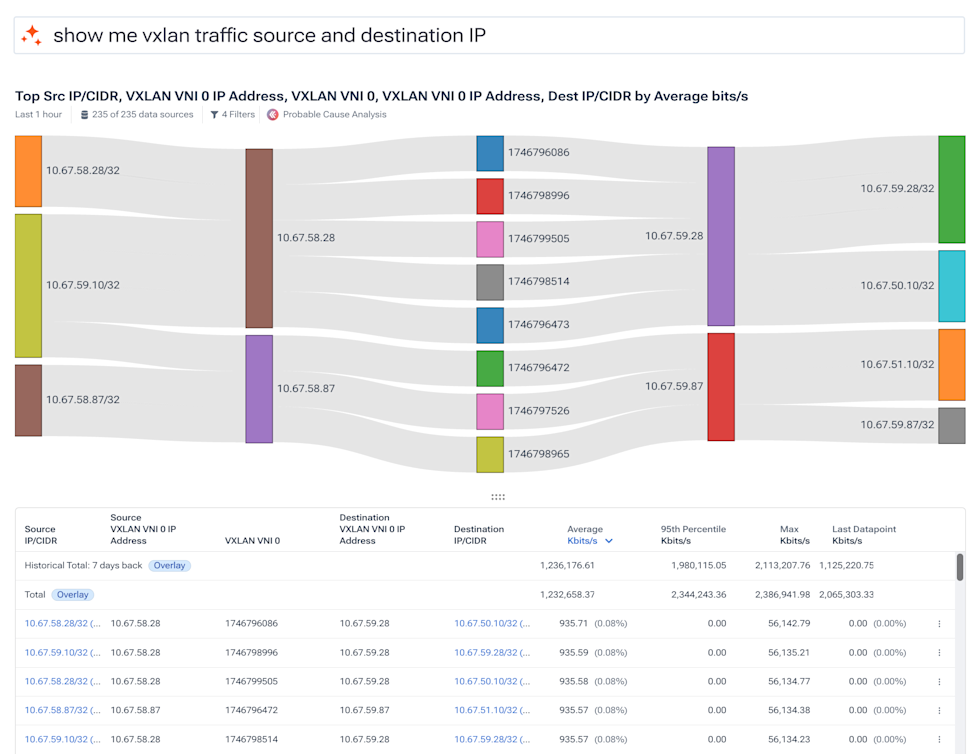
- Automatically map overlay networks like VXLAN to underlay network infrastructure.
- See into tunnels and VTEPs to analyze traffic across data center topology, even inside overlay networks.
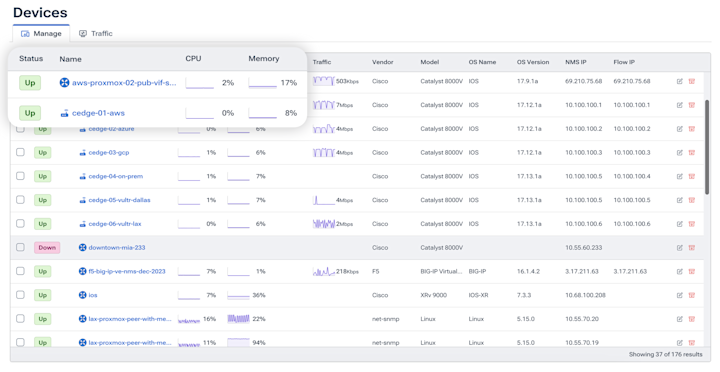
- Unify and correlate network telemetry — data center traffic, device metrics, internet data, and cloud flows — in one platform.
Optimal performance and speed
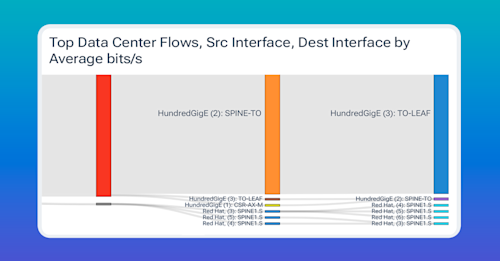
- Understand traffic flows, including tunneled traffic and elephant flows, to reduce latency and congestion.
- Enhance AI and application performance by optimizing east-west and north-south traffic.
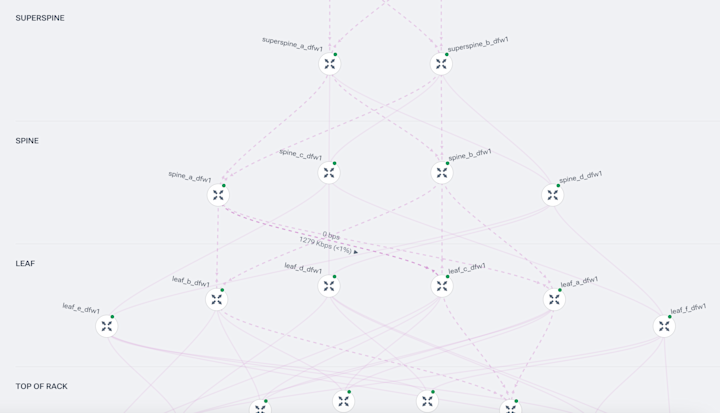
- Overlay past traffic patterns onto a topology to quickly investigate performance issues.
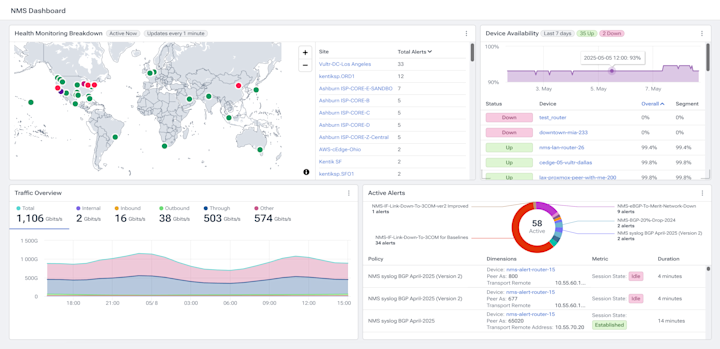
Stay two steps ahead
- Quickly remediate performance issues and maximize bandwidth with Kentik AI’s cause analysis.
- Get proactive anomaly insights and alerts on any issue data center network issue.
- Never miss critical microburst events or stalled workloads with gNMI streaming telemetry monitoring.
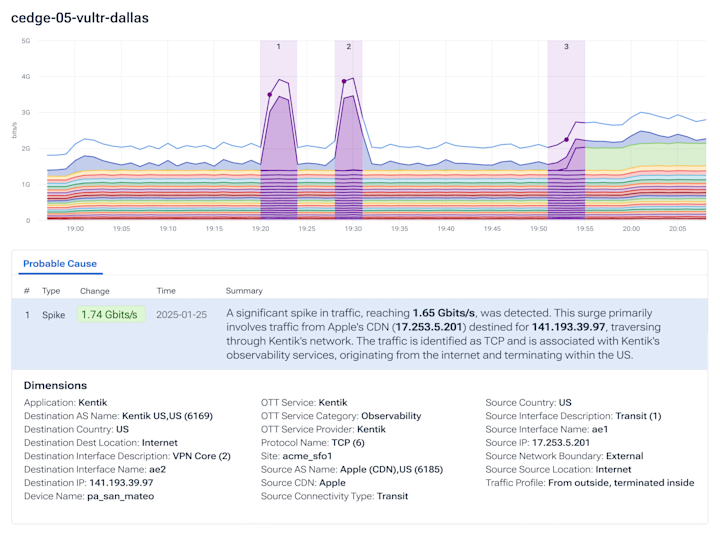
Intelligence for tomorrow’s AI data center
- Capture value from each job in lossless, ultra-low latency fabric.
- Prepare for growth and navigate AI-centric data center operations with a platform built by network experts to drive world-class operations.
Explore the platform
Data Center Network Optimization FAQs
How do I detect and investigate microbursts using flow telemetry?
Detect microbursts by collecting higher-frequency device telemetry (streaming telemetry) and then use flow analytics to attribute the burst to specific traffic. Kentik supports streaming telemetry for NMS and correlates device metrics with flow data in Data Explorer so you can identify where the microburst occurred and which flows/applications caused it.
How do I get visibility into VXLAN overlays without losing underlay context?
Modern data center overlays can hide who is really talking to whom and which physical paths are carrying the traffic. Kentik helps by mapping VXLAN overlay networks to the underlay infrastructure and showing traffic through tunnels and VTEPs, so teams can troubleshoot service-to-service connectivity and performance using a single, topology-aware view. For more detail, see Data Center VXLAN Overlay Visibility at Scale.
How do I detect elephant flows and reduce fabric congestion?
Elephant flows can distort traffic distribution and create localized congestion even when overall utilization looks healthy. Kentik provides real-time visibility into traffic flows (including tunneled traffic and elephant flows) so you can identify which flows are driving congestion, see where they traverse the fabric, and make smarter routing and capacity decisions to reduce latency and hotspots. Related deep dive: Elephant Flows: The Hidden Heavyweights of AI Data Center Networks.
How do I identify ECMP imbalance or idle links in a leaf-spine fabric?
ECMP hashing can produce “some links hot, some links idle” behavior that wastes expensive bandwidth and creates bottlenecks. Kentik lets you compare traffic across links and paths, overlay traffic patterns onto a topology view, and pinpoint where imbalances persist so you can adjust routing, hashing, or design assumptions with evidence. See: Identifying Idle Paths in a Data Center Leaf-Spine Fabric.
What telemetry should I collect to optimize data center fabric performance?
Effective fabric optimization requires more than periodic polling. Collect flow telemetry for traffic visibility, device metrics for health and capacity signals, and high-frequency streaming telemetry for short-lived events. Kentik unifies and correlates data center traffic and device telemetry in one platform and supports gNMI streaming telemetry so you can detect microbursts and other fast events traditional tools miss. Useful background: The Benefits and Drawbacks of SNMP and Streaming Telemetry and How Hard Is It to Migrate to Streaming Telemetry?.
How can I proactively detect data center network issues before they impact applications or AI workloads?
Proactive detection starts with anomaly insights and alerts tied to signals that predict impact: microbursts, congestion, stalled workloads, and path changes. Kentik provides proactive anomaly insights and uses high-frequency telemetry plus cause analysis to help teams remediate performance issues quickly and avoid “all green” dashboards hiding real problems. For examples of the kinds of issues that get missed with averages and coarse polling, see Closing Visibility Gaps in the Modern Data Center and Real-Time Alerting for AI-Optimized Data Centers.
How do I optimize east-west and north-south traffic for application and AI performance?
Optimizing application and AI performance requires understanding how traffic moves inside the fabric (east-west) and into/out of the data center (north-south), including tunneled traffic. Kentik helps by mapping overlay-to-underlay paths, showing real-time traffic visibility across the fabric, and enabling data-driven routing and capacity decisions to reduce latency and bottlenecks. Related context: The Evolution of Data Center Networking for AI Workloads.
