What is Observability? An Overview
Observability is rapidly becoming a cornerstone in IT and cloud computing, enabling professionals to gain deeper insights into their systems. This guide offers an introduction to observability, shedding light on its importance and how it differs from traditional monitoring methods. We introduce the core concepts of observability, its practical applications, and its benefits for NetOps, DevOps, and SRE roles. Read on to explore how observability can improve system efficiency and reliability.
What is Observability?
Observability, originating from control theory, is the capability to infer the internal state of a system solely based on its external outputs. In IT and cloud computing, observability encompasses more than just measuring system states. It taps into diverse data points, such as logs, metrics, and traces, generated by every component—from software and hardware to containers and microservices—across multicloud environments. The essence of observability is to decode the complex interactions among these components, in order to swiftly pinpoint and rectify anomalies, ensuring optimal system performance, reliability, and exceptional user experience.
For a deeper dive into observability’s specific application in networking, refer to our entry on network observability.
Kentik in brief: The Kentik Network Intelligence Platform brings observability to networks by combining multiple telemetry sources into a single model of traffic, routing, device health, and performance. This lets infrastructure teams ask better questions, detect meaningful changes, and troubleshoot across cloud, data center, WAN, and internet segments with enough context to connect symptoms to root cause.
Learn how AI-powered insights help you predict issues, optimize performance, reduce costs, and enhance security.

Addressing Core Pain Points with Observability
Every professional in the NetOps, DevOps, and SRE realms confronts recurring challenges: System uptime is non-negotiable, performance optimization is a constant endeavor, and rapid incident response is always in demand. So, how does observability address these pain points?
-
System Uptime: With observability’s granular insights, teams can proactively identify potential issues that might lead to system downtime. Observability tools can flag a minor problem, ensuring that uptime remains consistent before that small problem snowballs into a critical failure.
-
Performance Optimization: Observability goes beyond just identifying issues; it offers a comprehensive view of system performance. By understanding how different components interact and where potential bottlenecks lie, teams can continuously optimize for peak performance.
-
Rapid Incident Response: In the unfortunate event of an incident, time is of the essence. Observability equips teams with real-time data, allowing them to pinpoint the root cause swiftly and implement fixes, reducing the mean time to resolution (MTTR).
For professionals grappling with these challenges daily, observability isn’t just a tool—it’s a lifeline.
How does Observability Work?
In IT and cloud computing, observability represents the capability to deduce a system’s internal status from the external data it produces. This data encompasses telemetry in the form of logs, metrics, and traces. The foundation of observability is active instrumentation of various components across environments, ensuring that every piece of data – an event, a log, or a metric – is captured in a meaningful way. Through observability, teams can assemble a comprehensive, real-time picture of system health, performance trends, and potential anomalies, facilitating proactive problem resolution and continuous optimization.
Logs
Logs are textual records generated by software components. They capture specific events or transactions at any given point in time. Logs are crucial in observability as they offer a chronological account of events, errors, or transactions. This makes them an invaluable resource for post-event analysis and debugging. Whether it’s an error thrown by a backend service or a transaction record in a database, logs provide the raw, detailed context that is often essential to understanding the nuances of a particular incident or anomaly.
Metrics and Telemetry
Metrics (a form of telemetry) are numeric measurements collected over intervals, reflecting various aspects of system behavior. They can represent anything from CPU utilization and memory consumption to API request rates or database query counts. By analyzing metrics, teams can identify trends, detect performance regressions, and spot potential bottlenecks. When anomalies occur, metrics offer a snapshot of the system’s state at that time, aiding in quick diagnosis. Over the long term, metrics serve as baselines and benchmarks for system health and performance.
Distributed Tracing
In modern architectures – especially microservices – a single user request may traverse many services and components before completing. Distributed tracing allows teams to follow these requests across service boundaries, recording latency and processing details at each step. Each trace is like a story of the request’s journey through the system. By examining traces, teams gain insight into inter-service dependencies and can identify where slowdowns or errors occur. This end-to-end visibility ensures efficient request handling and helps pinpoint issues (like a poorly performing microservice or a network hop causing delays) that would be hard to isolate otherwise.
User Experience
While system-centric metrics and logs are crucial, understanding the end-user perspective adds another layer to observability. User experience (UX) monitoring captures data on how real users interact with applications. For example, page load times, user click paths, or error rates in user transactions. Integrating this user-centric data into the observability framework helps correlate backend performance with frontend experience. By observing UX patterns (like a spike in page load time or users abandoning a workflow), organizations can ensure that optimizations actually translate to improved satisfaction and retention. In essence, combining UX data with system telemetry lets teams prioritize issues that have the greatest impact on users.
Learn how AI-powered insights help you predict issues, optimize performance, reduce costs, and enhance security.

Embracing Automation and Integration
Modern tech stacks are a complex web of tools, platforms, and services. Manually monitoring each component is not only tedious, it’s inefficient. This is where the power of automation, bolstered by observability, comes into play:
-
Automated Alerts: Teams can define specific criteria or thresholds for normal system behavior. Observability tools automatically generate alerts when anomalies or threshold breaches occur, ensuring teams are instantly aware of potential issues. This real-time alerting prevents minor issues from going unnoticed until they become major incidents.
-
Integration with DevOps Tools: Observability platforms increasingly integrate with popular DevOps and ITSM tools, creating an ecosystem where data flows freely between systems. Whether it’s CI/CD pipelines, container orchestration platforms, or configuration management databases, observability ensures each tool has the relevant data it needs. For example, an observability platform might send metrics to an auto-scaling tool to trigger adding more resources, or create tickets in an incident management system when certain patterns arise. Support for open standards (like OpenTelemetry for telemetry data) is also key. This integration allows diverse systems to emit and collect observability data in a compatible way, reducing integration complexity.
-
Streamlined Workflows: With automation in place, routine tasks such as data collection, anomaly detection, and even some remediation can be handled programmatically. This frees up experts to focus on complex problems that truly require human insight. For instance, an observability system might automatically execute a script to clear a cache or restart a service when a known failure pattern is detected. Such automated, closed-loop workflows mean faster response and fewer repetitive tasks for engineers.
Observability serves as the backbone that ensures these automated actions are informed by accurate, real-time data.
Enhancing Discoverability with Observability
In any complex IT ecosystem, visibility is only the first step – understanding is the real goal. Observability doesn’t just dump raw data on a dashboard; it enhances the discoverability of intricate interactions within the system. Whether it’s the flow of data between microservices or the response time of a particular API call, observability gives teams clear visibility into each facet of their operations.
This heightened transparency makes it easier to trace cause-and-effect through the system’s components. Ultimately, improved discoverability means issues can be discovered and resolved before they impact end-users, and opportunities for optimization can be identified more readily. By illuminating the hidden corners of complex systems, observability enables proactive improvements rather than reactive fixes.
What is the Difference Between Observability and Monitoring?
The terms “observability” and “monitoring” are related and often mentioned together, but they are not identical. Each has a distinct role in managing systems, and understanding these nuances helps organizations use both effectively.
Traditional Monitoring
Monitoring is the practice of continuously checking a system’s health or performance against a set of predefined metrics or known indicators. It’s inherently rule-based. You establish thresholds or conditions (for example, CPU usage above 90%, or an HTTP 500 error in the web server log), and if those conditions are met, the monitoring system triggers an alert. Think of monitoring like a security camera with a motion sensor – it rings an alarm when something specific (and programmed) happens.
Monitoring excels at catching known failure modes or breaches of expected behavior. However, it is generally reactive and focused on the symptoms (“what happened”) rather than the underlying cause.
For a more in-depth discussion of the evolution of network monitoring, see our article on network monitoring’s transition to network observability.
Observability
Observability is the capability to understand a system’s internal state based on its external outputs, without needing to predefine every question or alarm. It provides an open-ended exploratory ability. In practice, this means teams can investigate why something is happening, not just be notified that it happened.
With rich observability data, engineers aren’t limited to known failure conditions. They can ask new questions on the fly. For example, if an application is slow, a team could use observability data to discover whether the cause lies in a specific microservice, a database query, or a network issue (even if no explicit alert was set up for that exact scenario). Observability encourages a proactive and inquisitive approach to system health.
Key Differences between Observability vs Monitoring
-
Depth of Insight: Monitoring tells you when something goes wrong based on predefined criteria. Observability, on the other hand, empowers you to explore data freely, allowing you to understand the root cause of issues, even if they weren’t anticipated.
-
Proactivity vs. Reactivity: Monitoring is largely reactive. You receive alerts for known issues when they occur. Observability is more proactive, enabling teams to identify and address potential problems before they escalate.
-
Handling Complexity: In modern, distributed systems (microservices, serverless, multicloud, etc.), there are many interdependencies and emergent behaviors. Traditional monitoring, which watches a fixed set of metrics, may miss complex issues that don’t violate a specific threshold. In these environments, observability provides a holistic view and the ability to drill down into any part of the stack. It captures the “unknown unknowns” – issues you didn’t anticipate in advance – which is crucial for highly dynamic systems.
Complementary, Not Competitive
While observability and monitoring are distinct concepts, they work best in tandem. Monitoring provides a safety net for known issues. It’s an early warning system for expected problems, ensuring rapid response when something breaks. Observability complements this by equipping teams with the data and tools to deeply investigate and understand any issue, including novel or complex ones.
In practice, a mature operations strategy will include both. Use monitoring to catch and alert on baseline breaches, and use observability to analyze, troubleshoot, and ultimately prevent both known and unknown issues.
Scaling with Confidence: Observability in Large Systems
As organizations grow, their IT systems become more distributed and complex. Modern NetOps and SRE teams may oversee globally dispersed infrastructures with thousands of components. Observability provides the end-to-end visibility and real-time insights needed to manage this complexity effectively. By continuously gathering and correlating telemetry from across the environment, a robust observability platform allows teams to understand system behavior and spot issues amid the scale.
Distributed Systems
In distributed environments, observability tools aggregate data from many disparate sources—on-premises datacenters, cloud services, edge devices—and present it as one cohesive big picture. For example, a network observability platform can provide hybrid cloud visibility spanning data centers and multiple public clouds in a single view. This unified perspective is critical for identifying problems that only become apparent when examining cross-system interactions. With end-to-end visibility, operators can quickly pinpoint which domain or component in a global system is responsible for an anomaly. Observability breaks down data silos and ensures that even widely distributed systems can be monitored and understood holistically.
Microservices Architecture
The rise of microservices and container orchestration means an application might consist of hundreds of ephemeral services that scale up and down rapidly. Observability—particularly distributed tracing—gives insight into how these services interact by following requests through the entire microservice call chain and mapping inter-service dependencies. This makes it possible to visualize bottlenecks and latency across complex service dependencies and to ensure the overall application remains performant as more services are added or changed. For example, if a microservices-based application is experiencing high latency, an observability platform can pinpoint the exact service (or even a downstream dependency several layers deep) that is causing the slowdown. Without such comprehensive traces and metrics, isolating the root cause in a labyrinth of microservices is extremely difficult at scale.
Capacity Planning
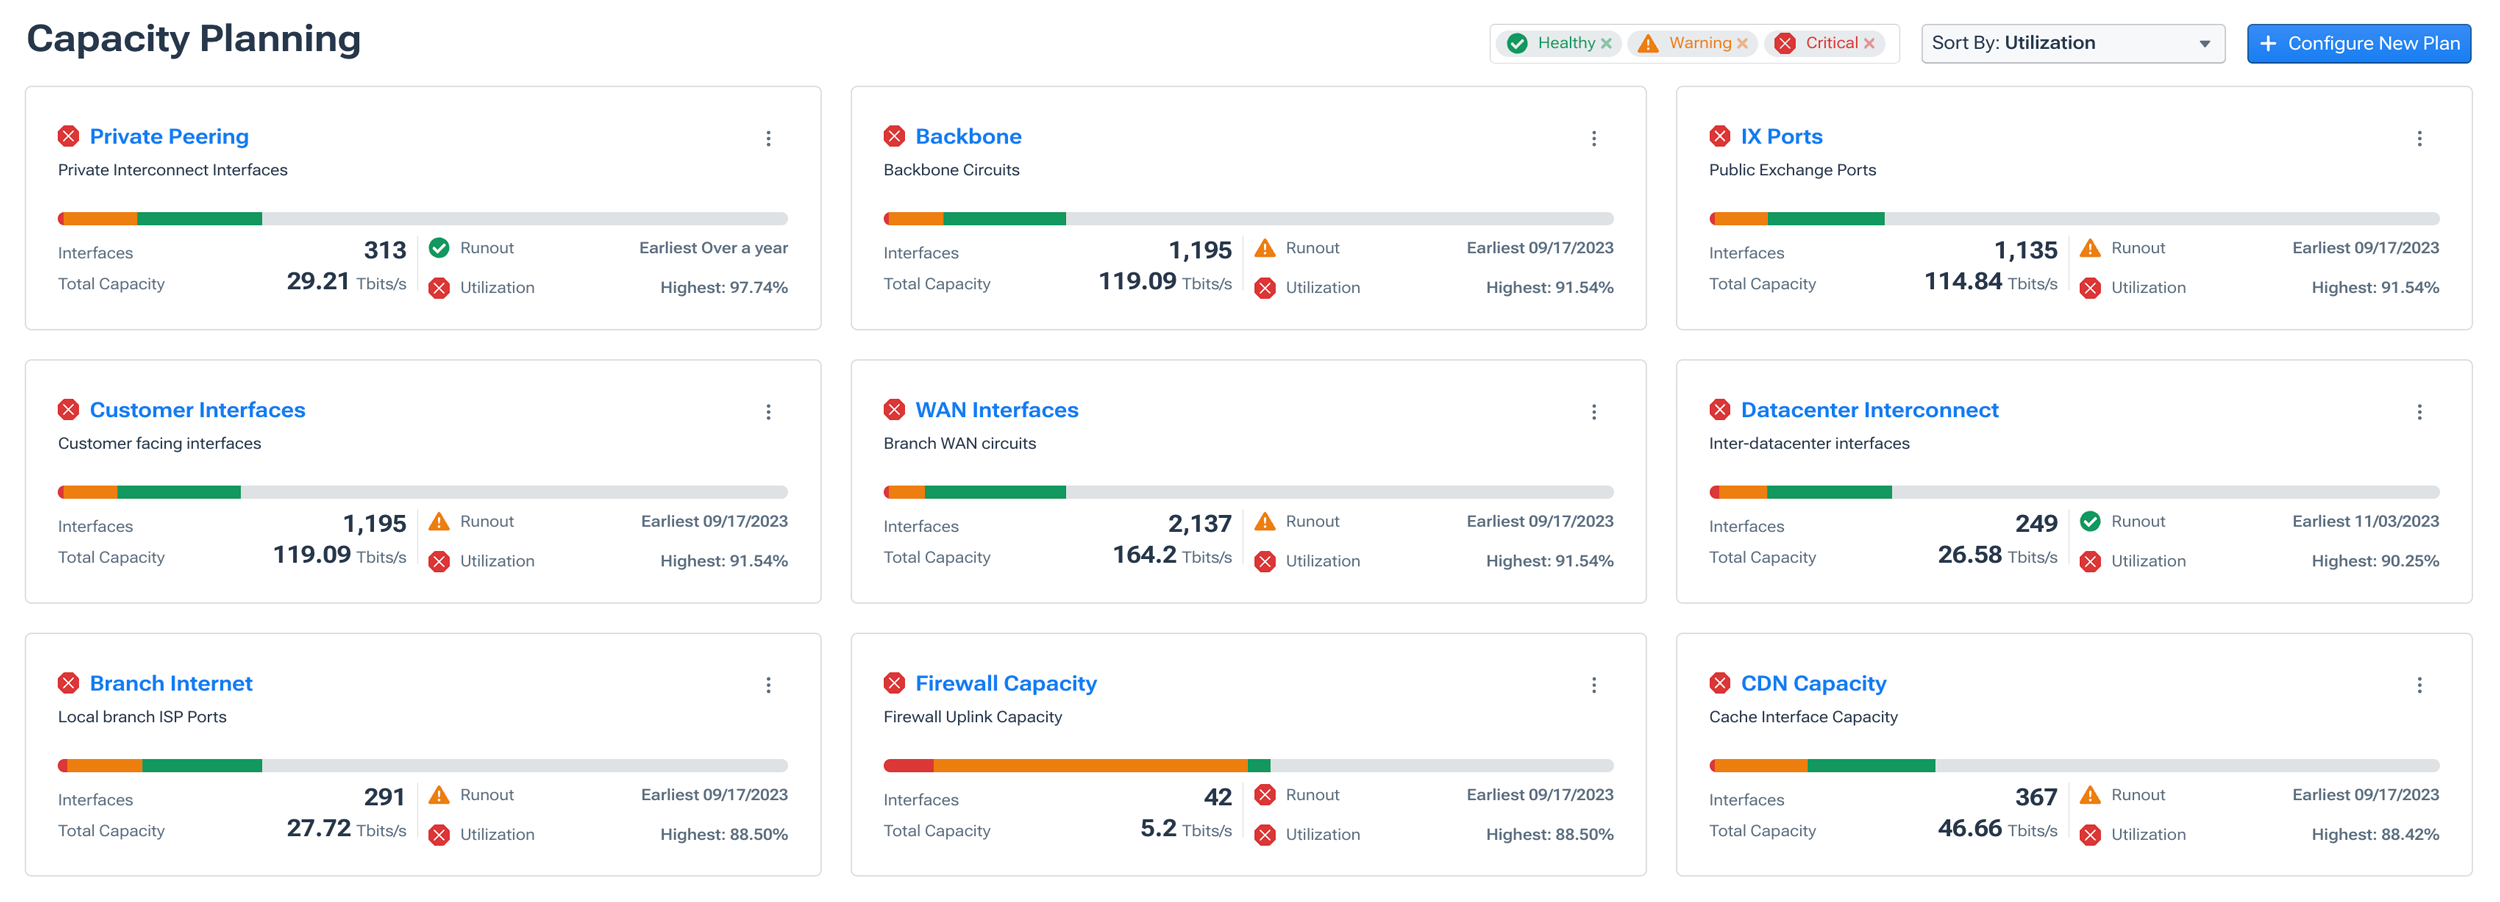
As user traffic grows, infrastructure (especially the network) must grow with it. Observability data feeds into capacity planning by highlighting current utilization trends and helping to forecast future needs. Modern network observability platforms expose key metrics like link utilization and runout, an estimate of when traffic on a given interface will exceed its available bandwidth based on current growth.

For example, the system might reveal that a certain WAN link consistently runs at 80% bandwidth utilization during peak hours, and project a runout date within the next quarter if trends hold. Armed with this insight, teams can proactively schedule upgrades or redistribute traffic before capacity is exhausted, preventing surprise outages due to saturation. Observability-driven forecasting ensures resources are added in a timely manner and optimizes allocation to meet demand without over-provisioning.
Why is Observability Important?
Modern systems are distributed and interdependent. A fault in one service or network path can quickly surface as a user issue. Observability provides the data and context to operate these environments reliably:
-
Reliability and performance: Continuous telemetry from services and the network exposes bottlenecks, errors, and saturation early. Teams can correlate signals, uphold SLOs (service level objectives), and address issues before they degrade availability or user experience.
-
Incident diagnosis and resolution: Centralized logs, metrics, and traces make it straightforward to query, correlate, and pinpoint root cause. Clear context shortens MTTR (mean-time-to-resolution) and limits incident impact.
-
Delivery and operations feedback: Production visibility shows how changes behave in real conditions. Teams can verify releases, detect regressions, roll back when needed, and support effective post-incident reviews with concrete evidence.
What are the Benefits and Challenges of Observability?
Observability provides the data and context needed to run complex systems reliably. Here’s a concise view.
Benefits of Observability
-
Faster diagnosis and repair: Correlated logs, metrics, and traces identify the failing component and its blast radius, cutting mean time to resolve (MTTR).
-
Early risk detection: Trends and anomalies reveal regressions, capacity pressure, and configuration drift before users are affected.
-
Performance optimization: End‑to‑end visibility surfaces hotspots and cross‑service dependencies, supporting latency and availability objectives.
-
Evidence‑based decisions: Production signals inform architecture changes, capacity planning, and release readiness.
Challenges of Observability (and how to manage them)
-
High data volume: Apply aggregation, sampling, cardinality controls, and tiered retention to manage cost and query performance.
-
Integration complexity: Prefer open standards (e.g., OpenTelemetry) and platforms with broad, out‑of‑the‑box collectors to reduce glue work.
-
Signal vs. noise: Tie alerts to user‑facing SLIs/SLOs, use dynamic baselines/anomaly detection, and keep dashboards focused on decisions.
-
Cost and runtime overhead: Instrument critical paths first, tune collection intervals, and regularly prune low‑value telemetry.
Network Observability
Network observability is the ability to answer what’s happening and why in the network, in real time. It brings together flow records, routing/BGP changes, packet telemetry, device/interface metrics, and synthetic tests to show how network state impacts applications across data centers, clouds, and edge.
-
What it solves: Rapid root cause analysis (congestion, loss, routing changes), path/dependency analysis, and capacity/runout forecasting.
-
Why organizations need it: Application‑centric tools rarely see prefixes, BGP, or link health and network observability closes that gap.
For more on this topic, see What is Network Observability?
AI Observability
AI fabrics (GPU clusters for training/inference) demand high throughput and low, predictable latency. Observability tracks per‑link utilization, congestion signals, end‑to‑end latency/jitter, and drops to keep jobs on schedule. AI observability can help to:
-
Operate the fabric: Pinpoint hot links, faulty ToR ports, or imbalanced paths, and reroute or scale before workloads stall.
-
Make it smarter: Apply machine learning and AI to telemetry for anomaly detection, runout forecasts, network troubleshooting, and automated remediation (AIOps/network intelligence).
For more on this topic, see AI Networking 101.
Get the Benefits of Network Observability with Kentik
In the ever-evolving IT and cloud computing landscape, staying ahead of potential issues is not just a best practice—it’s a necessity. Observability provides the in-depth insights and proactive approach required to ensure that systems are not just operational but optimized.
The Kentik Network Intelligence Platform empowers network pros to plan, run, and fix any network. To see how Kentik can bring the benefits of network intelligence and observability to your organization, request a demo or sign up for a free trial today.


