Top Network Operations Challenges in 2026: How Kentik Can Help
In 2025 and beyond, network operations (NetOps) teams face unprecedented challenges. Modern networks are distributed across on-prem data centers and multiple clouds, flooded with traffic from IoT and AI workloads, and constantly targeted by evolving security threats. At the same time, businesses expect networks to be always-on, high-performance, and cost-efficient. These challenges reflect how NetOps responsibilities are expanding beyond availability into performance optimization, cost governance, and security enforcement. In this article, we explore six top NetOps issues for 2026 and how Kentik’s network intelligence platform, with its newest tools and features, helps address each challenge.
1. Hybrid/Multi-Cloud Complexity and Visibility Gaps
Today’s networks span hybrid and multi-cloud environments, which have fundamentally different architectures than traditional data centers. Applications and data now shift between on-premises and various clouds, making the network highly dynamic and harder to visualize. Traditional monitoring tools struggle to provide a single point of observability across such heterogeneous infrastructures. NetOps teams often find it difficult to piece the network together fast enough to troubleshoot issues. Discovering all the cloud instances, containers, VPCs, and on-prem devices involved in a service path is time-consuming. Hybrid clouds are complex and challenging to work with, and lack of unified visibility leads to blind spots in performance and connectivity.
Kentik’s Solution for Modern Cloud Complexity
Kentik is designed as a comprehensive platform to illuminate the entire hybrid network in one place. Key capabilities that help include:
-
Unified Network Mapping: Kentik’s multi-cloud observability features provide an interactive, context-rich map of hybrid cloud infrastructure. This automated map serves as a real-time source of truth, letting NetOps instantly see cloud resource topologies, interconnections, and traffic flows between cloud and on-prem environments. By visualizing everything in one unified view, teams can quickly understand how different cloud regions and data center networks tie together, ensuring nothing falls through the cracks.
-
Multi-Source Telemetry Integration: The Kentik platform unifies telemetry from cloud (e.g., VPC/VNet flow logs), on-prem devices (SNMP metrics, NetFlow/sFlow), and applications (synthetic tests, BGP routing data) into a single view. Unlike siloed tools, Kentik unifies and correlates cloud, device, flow, and synthetic data as part of a single platform experience. This means a NetOps engineer can see, for example, a drop in AWS throughput alongside on-prem router CPU spikes and synthetic user experience metrics, all in one dashboard. By aggregating data across environments, Kentik reduces visibility gaps caused by hybrid complexity.
-
Cloud Connectivity Insights: Kentik goes beyond basic monitoring by offering tools like Connectivity Checker, which can test connectivity between cloud or hybrid endpoints on demand. If an application tier in Azure cannot reach a database in a private data center, Kentik can help show where the connection is blocked. These on-demand insights into multi-cloud connectivity simplify troubleshooting in complex hybrid networks.
This short, silent video shows how Kentik Cloud provides comprehensive visibility across all major public clouds. Kentik enables seamless insight into cloud-to-on-prem network paths and the public internet routes connecting them. Kentik identifies latency, loss, jitter, and application-specific traffic while providing deep visibility into cloud networking constructs like ACLs to spot security issues. With powerful analytics, Kentik Cloud enables you to visualize intra-cloud traffic, identify idle resources for optimization, and leverage historical data to uncover trends and seasonal patterns—ensuring optimal cloud performance and cost efficiency.
2. Fragmented Toolsets and Siloed Monitoring
Many NetOps teams still rely on a patchwork of specialized tools: one for device health, another for traffic flows, another for cloud networks, and so on. In a 2025 EMA survey, 90% of organizations reported using two or more network observability tools, and 66% reported using three or more, underscoring how persistent and systemic tool sprawl has become in modern NetOps environments.
This tool sprawl creates a fragmented monitoring experience. Each tool surfaces only a partial view (such as devices, flows, or synthetic tests), making it difficult to assemble a complete, end-to-end understanding of network behavior. The lack of a single authoritative view means operators waste time switching between interfaces and correlating data manually. Separate, unintegrated tools also lead to data silos and inconsistent information, ultimately slowing down troubleshooting and increasing the risk of missing critical clues.
Kentik’s Solution for Tool Fragmentation
Kentik’s platform is built to consolidate and replace legacy monitoring tools with one unified solution. It breaks down silos by combining network and cloud observability in a single platform. Benefits of this all-in-one approach include:
-
Unified Dashboard and Context: NetOps teams get a shared view of network performance, health, cost, and security metrics via dashboards such as Observation Deck. Rather than juggling separate screens for on-prem router stats and cloud flow logs, Kentik brings them together. If an outage occurs, teams can correlate whether a data center device failure or a cloud routing issue (or both) is the cause without context-switching.
-
All-in-One Platform (Replace Legacy Tools): Kentik helps teams replace legacy NPM/NMS tools and troubleshoot across data center, cloud, campus, and internet networks in one place. The platform supports use cases from capacity planning to SD-WAN monitoring to traffic engineering, reducing the need for separate solutions. This consolidation can also reduce licensing and maintenance costs, and helps organizations simplify operations as networks grow.
-
Correlated Insights (No More Manual Stitching): By ingesting varied telemetry into a unified data model, Kentik can automatically correlate data that previously lived in different tools. Flow records are enriched at ingest with routing, DNS, geolocation, Kubernetes, and other context. This means an operator can ask questions like “show me traffic from branch offices to our cloud apps, with performance metrics and security alerts overlaid,” and Kentik’s data engine can answer across domains. The platform eliminates the manual work of merging datasets, accelerating root-cause analysis.
3. Explosive Growth of IoT and AI Workloads
Network demand is skyrocketing due to the scale of IoT devices and AI workloads in modern environments. Billions of IoT sensors and data-intensive applications (such as AI/ML training and inference) generate enormous volumes of network traffic. This creates two problems for NetOps: data scale and data velocity. Legacy monitoring systems often buckle under the volume.
Additionally, many legacy systems rely on slow polling (e.g., 5-minute SNMP intervals) which cannot capture short bursts or microsecond-level spikes common in high-throughput AI clusters. NetOps teams in 2026 need tools that can handle massive data ingestion and provide real-time insight, so they aren’t flying blind as network usage explodes.
Kentik Solutions for IoT and AI Datacenters
Kentik was built as a SaaS big-data platform to handle modern network scale. Features that help NetOps cope with IoT/AI-driven growth include:
-
Scalable Telemetry Ingestion: The Kentik Data Engine is a distributed datastore optimized for storing and querying huge volumes of network data (flows, metrics, and logs). Kentik’s approach emphasizes high-fidelity analytics built on modern telemetry pipelines and data engineering patterns as described in our blog post on escaping legacy monitoring approaches. This architecture helps teams analyze very large flow volumes and still query fast enough to troubleshoot effectively.
-
High-Fidelity Streaming Telemetry: To complement traditional SNMP, Kentik supports modern streaming telemetry protocols (such as OpenConfig/gNMI). Streaming telemetry delivers sub-second updates and captures fine-grained events that 5-minute polls would miss. By integrating streaming data, Kentik gives NetOps a live pulse of network health even as conditions change rapidly under heavy IoT or AI loads.
-
Cloud-Scale Performance Monitoring: As AI workloads often run in cloud or hybrid environments, Kentik monitors cloud network performance at scale. It can ingest VPC flow logs from AWS/Azure/GCP, track inter-region traffic flows, and use synthetic tests to continuously validate connectivity to critical services. This outside-in plus inside-out monitoring combination helps shorten the mean-time-to-know when third-party networks or internet paths degrade, a pattern discussed in Kentik’s network monitoring overview.
Learn how AI-powered insights help you predict issues, optimize performance, reduce costs, and enhance security.

4. Evolving Security Threats and Zero-Trust Requirements
Cyber threats are intensifying every year, and network operations teams are on the front line to detect and mitigate them. Distributed Denial of Service (DDoS) attacks remain at historically high levels, and NetOps must also contend with stealthy threats, from unauthorized communications (insider or lateral movement) to policy violations that expose vulnerabilities.
With the rise of Zero Trust architectures, organizations expect continuous monitoring of network traffic to verify and enforce security policy at all times. The issue is that many NetOps tools are focused on performance and lack deep security analytics, while security tools might not provide network-wide visibility. NetOps teams need integrated security intelligence to keep up with evolving threats.
Kentik Solutions for Network Security
Kentik bridges network observability and security, helping NetOps teams identify and respond to threats using the same platform. Security-focused features include:
-
Built-in DDoS Detection and Alerting: Kentik emphasizes DDoS detection and mitigation as a core use case and supports traffic-based analytics for rapid detection and response. Learn more about how Kentik’s DDoS detection and mitigation tools can help.
-
Network Traffic Analysis for Threats: Kentik can flag suspicious communication such as unusual port/protocol usage or unexpected spikes to sensitive servers. Teams can configure alerting, including security-oriented patterns, and multi-cloud observability can help flag communication with watchlisted hosts and surface critical anomalies.
-
Unified Security and Performance Monitoring: A key advantage is that Kentik doesn’t silo security data from network health data. It supports a unified view spanning performance, cost, and security, which is especially valuable for troubleshooting connectivity in Zero Trust environments where security groups, ACLs, and policy controls are part of the problem space.
5. Slow Troubleshooting and Need for Automation
As networks grow in complexity, the traditional reactive approach to troubleshooting (manually querying tools and hunting for the root cause) is becoming untenable. NetOps teams are under pressure to reduce downtime and MTTR (Mean Time to Resolution), but visibility and intelligence gaps make it hard to diagnose problems quickly.
In cloud-era networks, disruptions are harder to foresee and isolate because issues can stem from interdependencies and rapid change. Many organizations also face a skills and staffing gap, which increases the need for tooling that can help non-experts interpret network data. A top 2026 issue is how to inject more intelligence and automation into NetOps so troubleshooting can keep pace with complexity.
Kentik: AI-powered Solutions for NetOps
Kentik addresses the speed and automation needs of modern NetOps teams with analytics and AI-driven insights that speed up troubleshooting and support proactive operations:
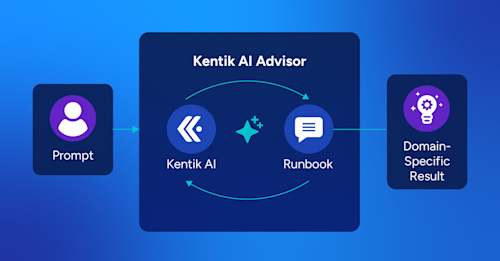
- AI-Powered Root Cause Analysis: Kentik AI Advisor with Cause Analysis can help identify and explain root causes of network issues. Kentik’s blog post on Cause Analysis describes how Cause Analysis is designed to provide plain-English explanations of underlying issues based on telemetry and detected changes, helping teams reduce time spent digging. Learn more about Kentik AI Advisor in this short video:
-
Proactive Anomaly Detection and Insights: Kentik establishes baselines for normal behavior and uses anomaly detection to catch issues early. Alerts and dashboards help teams move toward preventative (rather than reactive) operations.
-
Automation and Integration: Kentik can integrate with incident response systems and automation workflows. For example, Kentik can feed observability signals into Itential orchestration workflows, and broader coverage discusses using observability features to build automations and make changes in real time. These features support closed-loop operations as NetOps matures toward self-healing patterns.
6. Rising Operational Expectations and Cost Pressures
NetOps teams in 2026 face heightened business expectations. Networks must deliver higher performance, reliability, and agility, supporting new initiatives quickly while controlling costs. Meanwhile, cloud adoption can introduce volatile network costs (including egress fees, CDN, WAN costs) that can spike without appropriate visibility and governance. NetOps teams are asked to do more with less, balancing performance with cost-efficiency.
Kentik for Cost Control and Visibility
Kentik supports both technical insight and business context, including network cost visibility:
-
Network Cost Analytics: Kentik can help quantify traffic cost and tie it back to business-relevant dimensions. Cost visibility as a key part of modern network monitoring. Kentik enables evaluating cost by path, provider, region, or customer. And features like Kentik Traffic Costs helps turn traffic insight into commercial intelligence that helps teams negotiate smarter, protect margins, and boost profitability. Learn more about how Kentik can help reduce network spend
-
Capacity Planning and Optimization: Kentik provides tools to plan and optimize capacity across hybrid environments. Kentik multi-cloud observability can support analyzing traffic patterns and dependencies across migrations to balance performance with cost. This helps identify underutilized links, expensive transit, or inefficient cloud paths so teams can optimize spending without sacrificing reliability.
-
Consolidating Tools (Operational Efficiency): Consolidating monitoring reduces overhead and expense. Kentik’s solutions for consolidating legacy tools connect unified visibility to operational efficiency and reduced tooling sprawl. Combined with faster troubleshooting and AI-driven assistance, NetOps teams can stay productive even when headcount is limited.
Get Started with Kentik
The network operations landscape of 2026 is defined by complexity, scale, and high stakes. NetOps teams face multi-cloud networks, massive data volumes, relentless security threats, and demands for agility, all at once.
The Kentik Network Intelligence Platform combines:
- an integrated view for hybrid networks
- scalable analytics for modern telemetry
- security-oriented traffic visibility
- AI assistance for troubleshooting, and
- cost intelligence for business alignment.
By leveraging these capabilities, NetOps and IT decision-makers can keep their networks resilient and high-performing, turning daunting issues into manageable workflows.
Get started with Kentik: Start a free trial or request a personalized demo today.
FAQ About NetOps Challenges
What is NetOps?
NetOps (network operations) is a modern approach to operating networks that emphasizes agility and rapid change while using automation and orchestration. In practice, NetOps teams keep connectivity reliable and performant across data centers, clouds, and the Internet, while also supporting security controls and cost governance.
What are the biggest NetOps challenges in 2026?
Common NetOps challenges in 2026 include hybrid and multi-cloud visibility gaps, fragmented monitoring tools and data silos, explosive IoT and AI traffic growth, escalating security threats and Zero Trust requirements, pressure to reduce MTTR, and rising network and cloud costs.
What is the difference between network monitoring and network observability?
Network monitoring focuses on detecting and alerting when something is wrong. Network observability adds enough context and correlated telemetry to explain why it happened across domains like cloud networks, WAN/Internet paths, campus, and data center fabrics.
Why do hybrid and multi-cloud networks create visibility gaps?
Hybrid and multi-cloud networks spread traffic across on-prem data centers, multiple cloud providers, and unmanaged Internet paths. Different constructs (VPCs, subnets, security groups, load balancers) change frequently, which can create blind spots unless topology, flow, and performance telemetry are unified.
How can I get end-to-end visibility across AWS, Azure, GCP, and on-prem?
Look for a platform that unifies cloud flow logs, network flow (NetFlow/sFlow), device metrics, routing context (BGP), and synthetic tests into one view. Kentik’s multi-cloud observability and connectivity testing capabilities are designed to help teams see paths end-to-end and validate where connectivity breaks.
Why do NetOps teams end up using so many monitoring and observability tools?
Tool sprawl typically happens because teams adopt different tools for different domains: devices, flows, cloud networks, Internet paths, and user experience monitoring. Consolidating telemetry into a shared data model reduces swivel-chair troubleshooting and makes it easier to correlate signals during incidents.
Is SNMP still enough for network monitoring in 2026?
SNMP still has value for broad device health monitoring, but it can miss short-lived events when polling intervals are minutes long. Many NetOps teams pair SNMP with streaming telemetry for higher-fidelity, near-real-time visibility.
What is streaming telemetry (gNMI/OpenConfig), and why does NetOps care?
Streaming telemetry pushes structured device metrics continuously from network devices instead of relying on periodic polling. For NetOps, that can mean faster detection of congestion, drops, and microbursts, which is especially important for high-throughput AI and data center fabrics.
What is model-driven telemetry (MDT)?
Model-driven telemetry is a push-based approach where devices stream operational data to a collector in near real time using standardized models. It helps NetOps capture richer metrics at higher frequency and reduce blind spots that can occur with slower polling.
How do I monitor AI training traffic and high-throughput workloads without missing microbursts?
For AI-era traffic, prioritize high-volume flow analytics plus high-frequency interface and queue telemetry. Combining flow visibility with streaming telemetry helps you see both who is talking to whom and what the infrastructure experienced in the moment.
How can NetOps detect and respond to DDoS attacks faster?
Faster DDoS response starts with continuous traffic baselining, anomaly detection, and alerting that ties spikes to targets, protocols, and upstream paths. Flow-based analytics can help distinguish real attack traffic from misconfigurations and speed up escalation to mitigation or scrubbing workflows.
What does Zero Trust mean for NetOps monitoring?
Zero Trust requires continuous verification and policy enforcement, which makes visibility into east-west traffic and unexpected communications critical. NetOps monitoring helps validate segmentation, detect unauthorized paths, and determine whether an outage is policy-related or caused by an underlying network fault.
How can NetOps reduce MTTR in complex hybrid networks?
Reducing MTTR usually means reducing context switching: correlate topology, flows, metrics, routing changes, and synthetic tests in one place. AI-assisted triage can further cut time-to-diagnosis by pointing engineers to the most likely root cause and the evidence behind it.
How can NetOps control cloud networking costs like egress fees?
Start by attributing traffic to applications, paths, regions, and providers, then identify which flows drive high egress and transit spend. Network cost analytics can reveal avoidable cross-region traffic, inefficient routes, and workloads that should be rescheduled, cached, or re-architected.
What NetOps trends should teams plan for in 2026?
Expect more AI-driven traffic patterns, wider adoption of streaming telemetry, increased emphasis on unified observability across domains, tighter integration of security and performance data, and more automation aimed at proactive operations and cost governance.


