Kentik Use Cases for Network Operations & Network Monitoring
NetOps teams spend too much time proving what went wrong and not enough time fixing it. Modern networks span data centers, clouds, WAN/SD-WAN, and the public internet, and the truth of an incident is usually scattered across device metrics, traffic, and off-net dependencies.
This guide covers the most common network operations and network monitoring use cases for Kentik and links each one to the most relevant Kentik Solutions and product pages, so teams can move from “what changed?” to “what should we do next?” with evidence.
About Kentik: Kentik is a network intelligence platform for modern infrastructure teams. Kentik combines traffic telemetry, routing context, synthetic performance testing, and network/device metrics to help teams troubleshoot faster, improve performance and reliability, control cost, and strengthen security across data center, cloud, WAN/SD-WAN, and the public internet.
Learn how AI-powered insights help you predict issues, optimize performance, reduce costs, and enhance security.
NetOps and monitoring use cases at a glance
- Troubleshoot outages faster and reduce MTTR
- Modernize device and interface monitoring with Kentik NMS
- Plan capacity, forecast runout, and avoid congestion
- Consolidate legacy monitoring and reduce tool sprawl
- Operationalize telemetry with incident, SIEM, and automation workflows
- Example NetOps workflows (enterprise and service provider)
- FAQs about NetOps and monitoring
1. Troubleshoot network outages faster and reduce MTTR
Kentik helps teams reduce MTTR by correlating traffic, routing context, device health, and synthetic signals so incident investigations don’t require tool-hopping across silos.
Teams ask:
- What changed, what’s impacted, and what’s the smallest safe fix?
- Is it our network, the cloud, a SaaS provider, DNS, or an upstream path?
- Which users, apps, links, or sites were affected and where did traffic reroute?
What you need to see:
- Fast querying across high-cardinality dimensions (apps, ASNs, sites, cloud metadata, destinations)
- Alerts plus exploration that support “zoom out, then drill in” investigations
- Evidence that ties conclusions to underlying telemetry (auditable, repeatable, shareable)
How Kentik helps:
- Provides a unified view across data centers, WAN/SD-WAN, hybrid and multi-cloud, SaaS, internet, and campus networks.
- Enables deep exploration with hundreds of dimensions and highly granular filtering.
- Supports rapid pivots during incidents with fast queries and investigation workflows that connect “what changed” to impact.
- Helps teams separate “it’s the network” from “it’s upstream” with internet and dependency visibility plus synthetic testing.
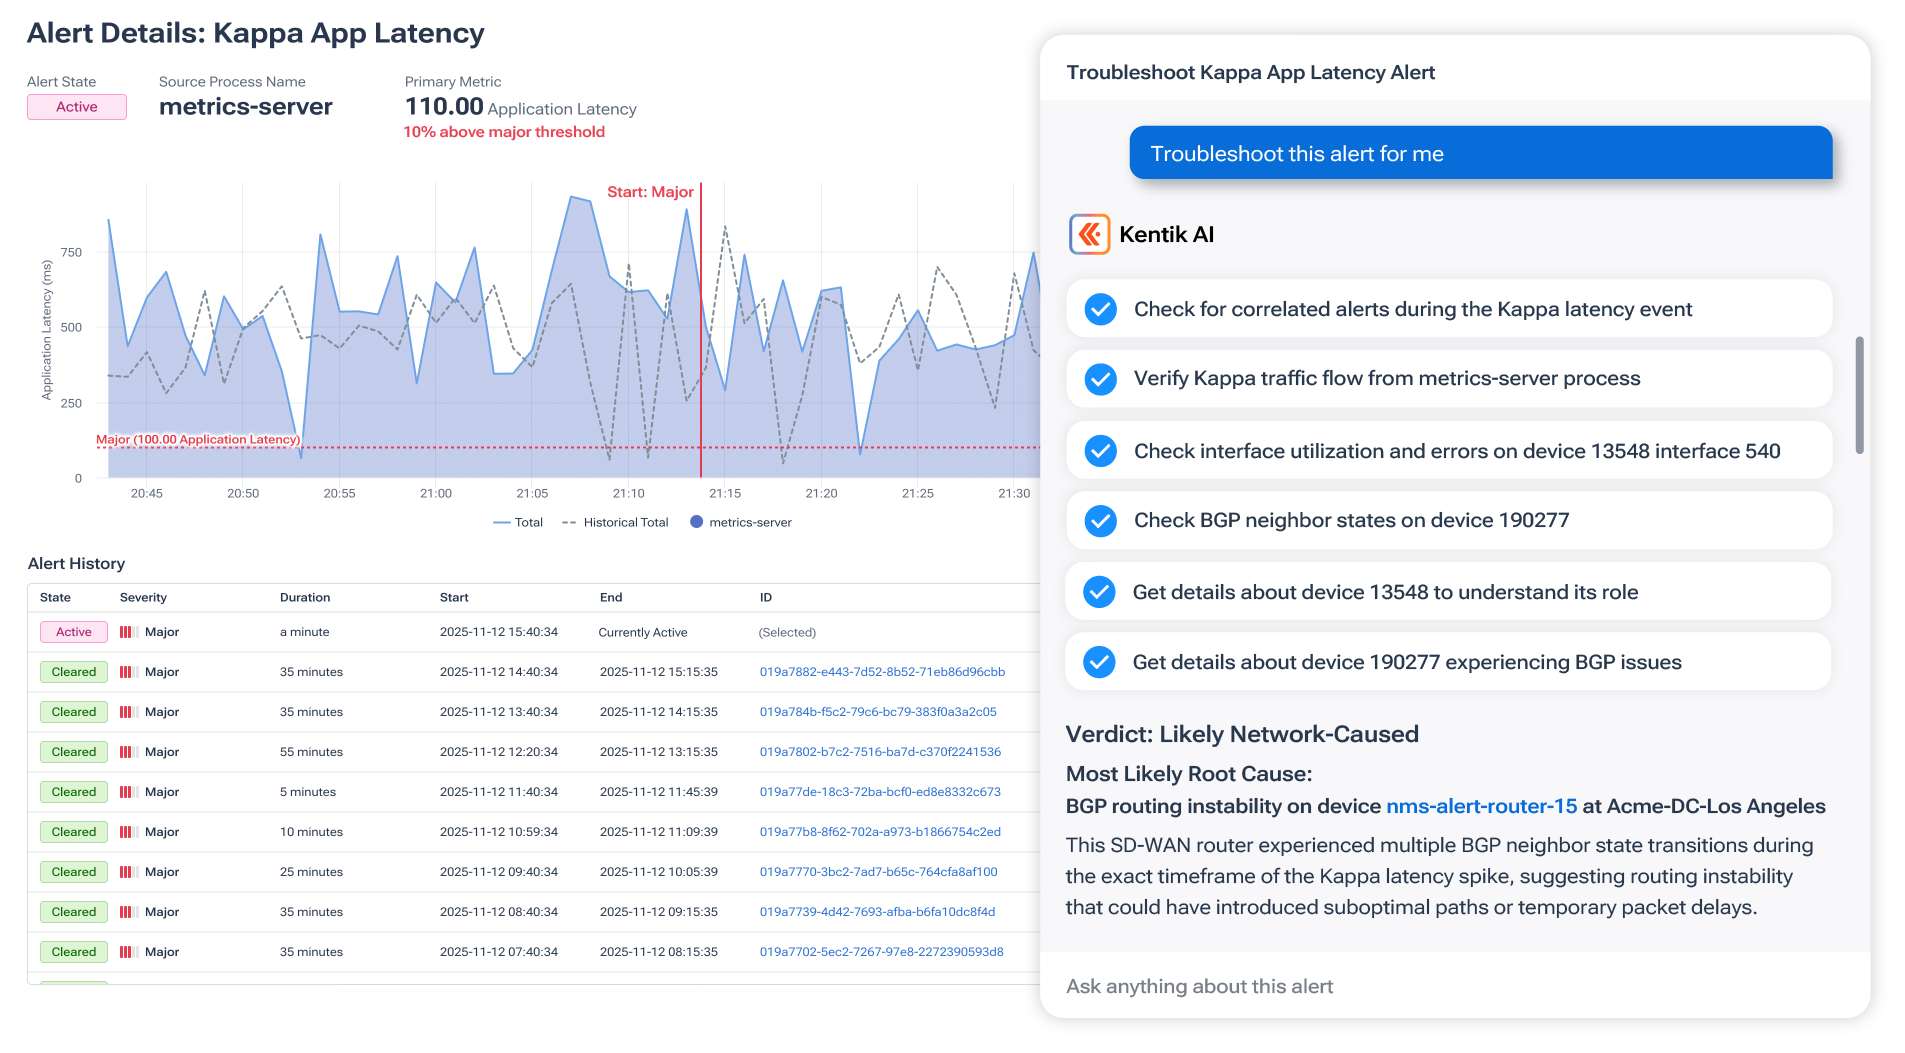
- AI Advisor reduces MTTR and speeds root cause analysis by interpreting natural language requests, reasoning through complex, multi-step network investigations, and running queries across your network telemetry.
Related pages:
2. Modernize network device and interface monitoring with Kentik NMS
Kentik NMS modernizes monitoring by unifying SNMP polling, streaming telemetry, and custom metrics so network device health can be correlated with traffic and experience in one platform.
Teams ask:
- Is a device, interface, or component failing, and how quickly can we detect it?
- How do we adopt streaming telemetry without losing visibility on legacy SNMP devices?
- How do we connect “what’s happening on the box” to what traffic and apps are impacted?
- Can we run device monitoring and traffic analysis in one operational workflow?
What you need to see:
- Vendor-agnostic device and interface monitoring with reliable alerting
- Support for SNMP plus streaming telemetry and custom metrics
- A fast polling cadence for quicker detection (and flexibility for legacy hardware)
- Correlation between network device health, traffic anomalies, and experience signals
How Kentik helps:
- Unifies telemetry by monitoring devices via SNMP while also supporting streaming telemetry and custom metrics in the same platform.
- Polls faster to detect issues sooner, and can use streaming telemetry for higher-frequency collection on supported gear.
- Connects device and interface metrics to traffic behavior and performance outcomes so investigations start with context.
- Delivers NMS as SaaS to reduce maintenance overhead while keeping extensibility via APIs and integrations.
Related product page: Network Monitoring System (NMS)

3. Plan network capacity, forecast runout, and avoid congestion
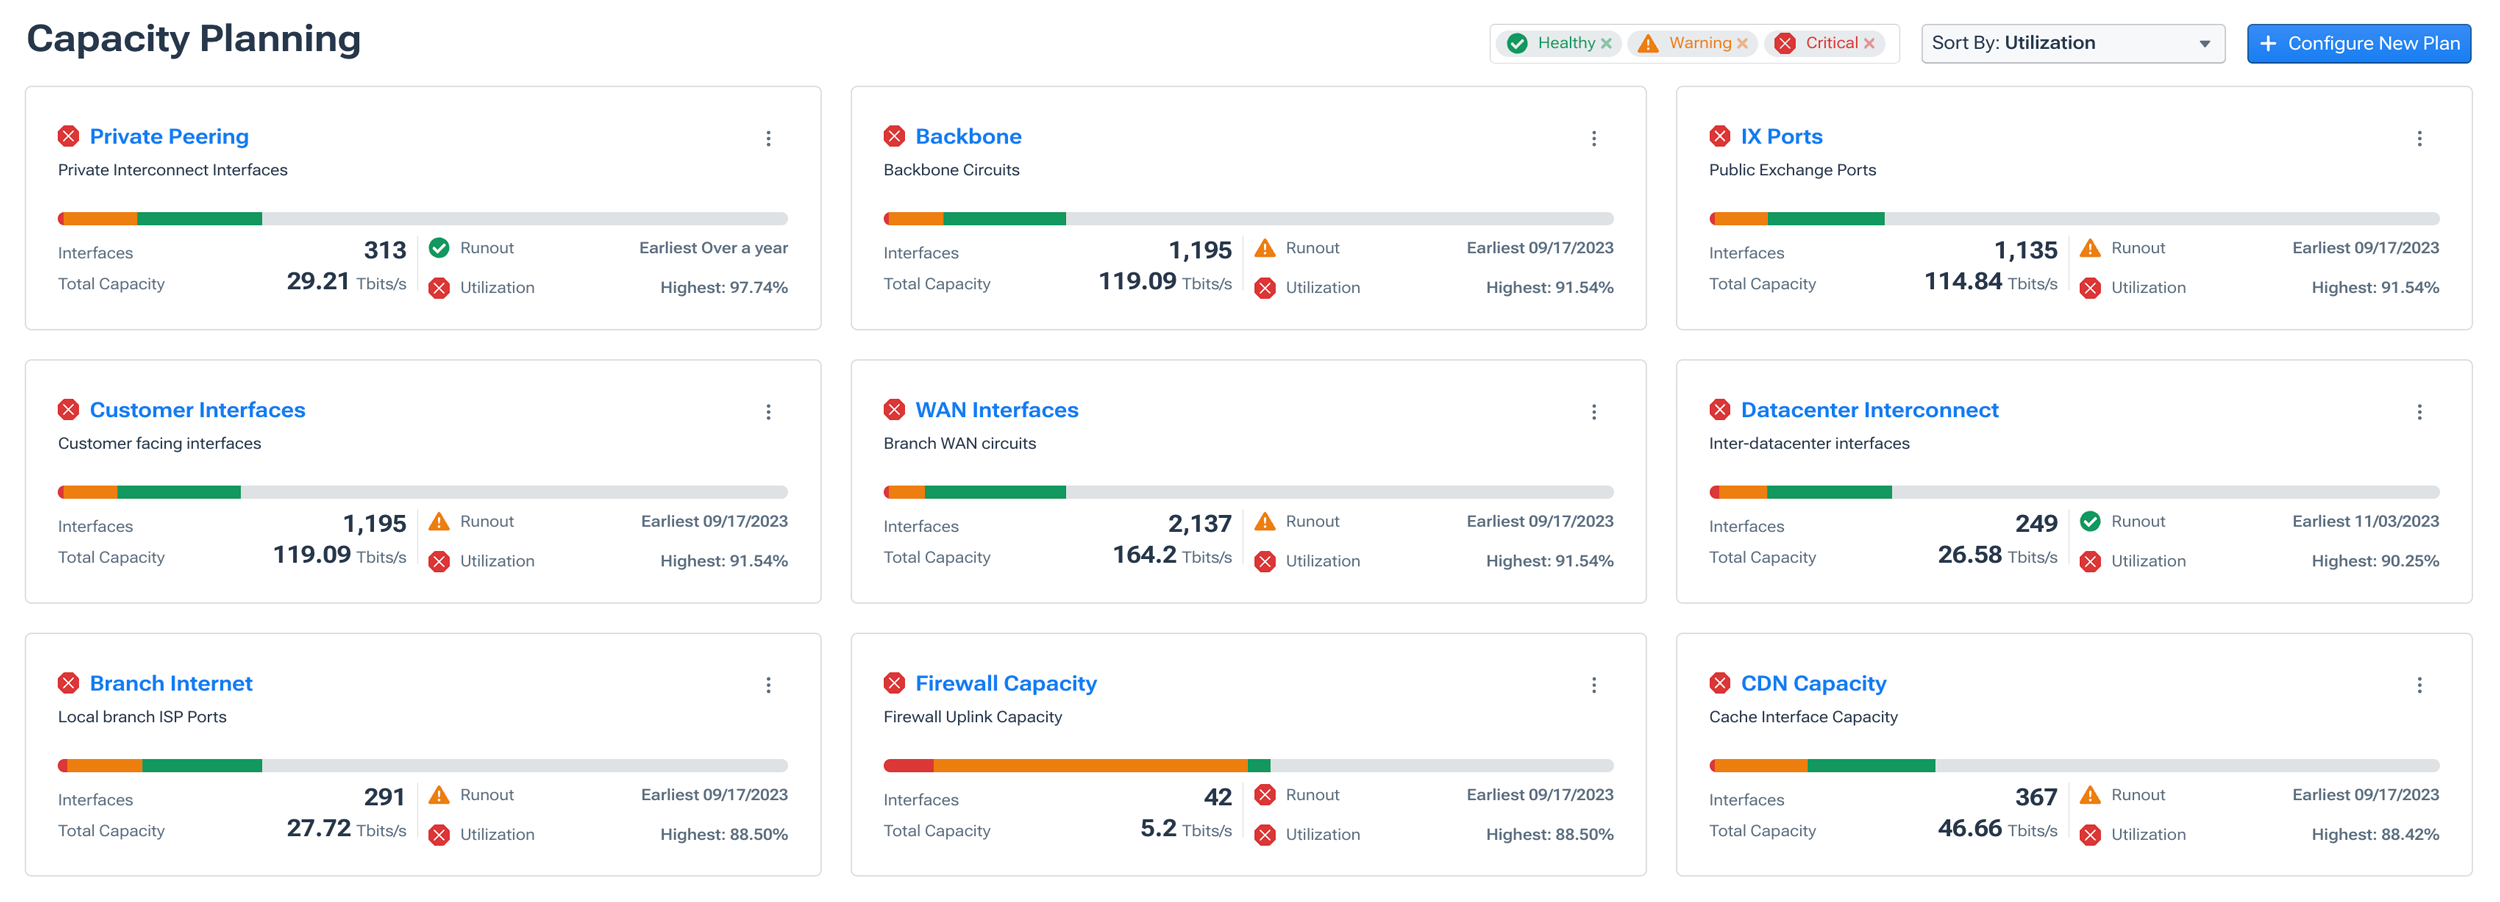
Kentik helps teams plan capacity with confidence using utilization visibility, baselines, trend analysis, and runout forecasting so upgrades are proactive, not reactive.
Teams ask:
- Which interfaces will run out first and when should we upgrade?
- What’s consuming bandwidth and what can we move, peer, shape, or optimize?
- Can we forecast demand without spreadsheet gymnastics?
- Are we underprovisioned (risk) or overprovisioned (waste)?
What you need to see:
- Link capacity, utilization, and performance over time
- Baselines and anomaly detection to spot bandwidth hogs
- Forecasting and runout projections tied to groups of links and criticality
- Visibility into “what” is consuming bandwidth (apps, endpoints, destinations, regions)
How Kentik helps:
- Provides immediate visibility into link capacity, utilization, and performance, with alerting before overload causes downtime.
- Establishes baselines to detect anomalous traffic and identify what is driving growth.
- Automates forecasting with runout projections (and cost-aware planning) so teams can plan upgrades with evidence.
Related solution page: Network Capacity Planning and Projections
4. Consolidate legacy monitoring and reduce tool sprawl
Kentik helps teams consolidate legacy tools by unifying telemetry and supporting multiple workflows (performance, cost, and security) in one platform, reducing operational overhead without losing visibility.
Teams ask:
- Why do we have multiple tools for partial views of the same incident?
- What can we retire without losing critical coverage?
- How do we share one operational truth across NetOps, CloudOps, and SecOps?
- Can we reduce cost while improving MTTR and coverage?
What you need to see:
- Unified telemetry that supports the key workflows your teams actually run
- A clear path to replace legacy NPM/NMS components and reduce monitoring overhead
- Cross-domain views that remove silos (cloud, internet, WAN, data center)
How Kentik helps:
- Consolidates network, cloud, and security telemetry and supports a unified view of performance, cost, and security.
- Enables replacement of legacy NPM/NMS tools while keeping high-value workflows like troubleshooting, multi-cloud visibility, and capacity planning.
- Supports an “observability data pipeline” approach: unify, enrich, and correlate network telemetry and share it with other systems when needed.

Related solution page: Consolidate Legacy Tools
Related review article: Learn about the Best Network Monitoring Tools for 2026
5. Operationalize telemetry with incident, SIEM, and automation workflows
Kentik helps teams turn telemetry into action by integrating network insights into incident management, SIEM, and automation workflows so investigations are faster and postmortems are evidence-backed.
Teams ask:
- How do we get the right network context into incidents and postmortems automatically?
- Can we route alerts to the right team with evidence, not guesswork?
- How do we share enriched network telemetry with analytics tools and data lakes?
What you need to see:
- Alerts and notifications that plug into existing ops tooling (ticketing, chatops, on-call)
- Enriched telemetry that is shareable (dimensions, context, evidence trails)
- APIs and integrations that support automation, routing, and reporting
How Kentik helps:
- Integrates network data into incident management and security workflows so teams can triage and respond with context.
- Supports automation with APIs and integrations so alerts can trigger consistent investigation steps.
- Exports enriched observability data to other platforms via Kentik Firehose for cross-domain analytics and long-term storage.
Related pages:
Example NetOps workflows (enterprise and service provider)
The sections above describe the core NetOps capabilities (incident troubleshooting, modern NMS monitoring, capacity/runout forecasting, tool consolidation, and operational integrations). Below are practical examples showing how teams combine those capabilities in day-to-day operations.
Enterprise workflow examples
1. “The app is slow” triage (prove where the bottleneck is)
- Start with the impacted time window and confirm scope (which sites, users, apps, destinations).
- Correlate traffic behavior with device/interface health and path or dependency signals.
- Use synthetic testing and internet visibility to confirm whether the issue is upstream (SaaS, DNS, cloud region) or on-net.
- Share an evidence-backed summary with the likely cause, scope, and next action.
2. “Interface errors and congestion” fast root cause
- Identify the impacted interface(s) and validate utilization and error signals.
- Break down traffic on the interface by application, source/destination, and ASN to identify top drivers.
- Decide the smallest safe fix: reroute, rate-limit, prioritize, or upgrade.
- Validate the outcome with before/after comparisons.
3. “Which links run out first?” proactive planning
- Group links by role (backbone, internet edge, cloud interconnect, site uplinks).
- Use forecasting and runout projections to prioritize upgrades based on risk and criticality.
- Attribute growth to traffic drivers so planning is tied to real usage (not vibes).
- Document the plan and track progress against forecasts.
4. “Reduce tool sprawl” consolidation plan
- List your top workflows (incident triage, device monitoring, capacity planning, off-net dependency checks).
- Map which legacy tools cover each workflow today and where overlap exists.
- Pilot Kentik for the overlapping workflows first, then retire tools as coverage is validated.
- Standardize investigation steps so incidents are handled consistently across shifts.
Service provider and NOC workflow examples
1. “Is it us or off-net?” NOC troubleshooting across dependencies
- Correlate traffic shifts with routing, device metrics, and synthetic performance signals.
- Check whether SaaS/cloud/DNS dependencies show degradation during the same window.
- Escalate with evidence: what changed, who is impacted, and where the fault likely sits.
2. Capacity planning across PoPs and uneven growth
- Forecast runout by market and link group, then attribute growth drivers (services, ASNs, destinations).
- Prioritize upgrades where congestion risk is highest and most customer-impacting.
- Validate post-upgrade outcomes and update baselines.
3. Multi-tenant customer visibility to reduce support load
- Provide customers self-service dashboards for traffic, performance, and incident context.
- Reduce repetitive “what happened?” tickets by making common insights visible.
- Differentiate services by packaging analytics and reporting.
Related page: My Kentik Portal
FAQs about NetOps and Network Monitoring
What’s the fastest way to reduce MTTR during network incidents?
Combine proactive detection (alerts, baselines, synthetics) with rapid investigation across correlated telemetry so teams can move from symptom to root cause without tool-hopping. Kentik supports this with fast troubleshooting workflows across unified telemetry. See: Troubleshoot Any Network
How do I determine whether the network is the cause when an app slows down?
Correlate user-reported slowness with traffic behavior, device and interface health, and upstream dependency signals. The goal is to isolate whether the bottleneck is in your backbone, WAN/SD-WAN, cloud connectivity, DNS, or a SaaS provider. See: Network Performance Monitoring
What should a modern network monitoring stack include beyond SNMP?
A modern stack includes device health telemetry (SNMP and streaming), traffic visibility (flows), and experience validation (synthetics), plus routing and internet-path context for dependencies outside your network. Correlation across these pillars is what turns monitoring into faster troubleshooting. See: Network Monitoring System (NMS)
How do I unify SNMP polling and streaming telemetry without running two NMS tools?
Use a platform, like Kentik, that supports vendor-agnostic SNMP plus streaming telemetry and custom metrics in the same data model, so alerting stays consistent and correlations (device health ↔ traffic impact) stay fast. See: Network Monitoring System (NMS)
How do I forecast bandwidth runout without spreadsheets?
Use automated trend analysis and forecasting to project runout by interface or link group, then tie the forecast to what traffic is driving growth. This makes upgrades proactive and budgetable. See: Network Capacity Planning and Projections
How do I identify what traffic is driving congestion on a link?
Break down traffic by application, source/destination, site, and destination ASN, then compare the congested time window to a baseline window. This isolates whether the issue is growth, misconfiguration, or a traffic shift. See: Network Capacity Planning and Projections
How can I consolidate network monitoring tools without losing visibility?
Consolidate telemetry (metrics, traffic, synthetics, routing and dependency context) in one platform and validate you can still execute your key workflows: troubleshooting, capacity planning, and cross-domain investigations. See: Consolidate Legacy Tools
How do I integrate network telemetry into incident management and SIEM workflows?
Route alerts to existing workflows with supporting evidence (time window, affected entities, context), then export enriched telemetry to the tools that drive response, detection, and reporting. See: Kentik Firehose
How do NOCs reduce MTTR when problems span on-net and off-net segments?
Use a single workflow that correlates traffic, routing, device metrics, and synthetic signals, and confirm whether upstream SaaS/cloud/DNS dependencies are degraded in the same window. See: Understand Internet Performance
How do service providers plan capacity across uneven growth patterns?
Forecast runout by market and link group and attribute growth drivers so upgrades target what is actually changing (services, ASNs, destinations). See: Network Capacity Planning and Projections
How can a multi-tenant customer portal reduce support load?
By giving customers self-service dashboards and reporting, many “what happened?” and “is it the network?” questions are answered without opening tickets. See: My Kentik Portal
How can service providers offer customer-facing analytics without building their own portal?
Service providers can offer customer-facing analytics by using a platform that supports tenancy, branded access, curated dashboards, and tenant-specific alerting. Kentik supports this with My Kentik Portal, which allows providers to create a customer-branded portal with curated dashboards, saved views, support links, and alerts, while ensuring that each tenant sees only its own network data.

