The Evolution of Network Monitoring: From SNMP to Network Observability and Network Intelligence
The world of network monitoring has evolved rapidly over the years, adapting to the ever-changing technological landscape. From the early days of Simple Network Management Protocol (SNMP) to today’s network observability platforms and emerging network intelligence systems, network administrators have access to a diverse range of tools and techniques to ensure the smooth operation of their networks. This article explores the evolution of network monitoring, highlighting the key milestones and technologies that have shaped the industry.
The Early Days: Simple Network Management Protocol (SNMP) for Network Performance Monitoring
Introduction to SNMP
In the late 1980s, SNMP emerged as a standard protocol for network monitoring and management. SNMP was designed to provide a simple, efficient way to monitor and manage network devices, such as routers, switches, and servers. The protocol quickly gained traction, becoming a foundational element of network management systems.
How SNMP Works
SNMP operates on a client-server model, with network devices acting as servers and network management systems as clients. SNMP uses a hierarchical structure known as the Management Information Base (MIB) to organize and manage device information. SNMP employs a request-response communication model, where the management system sends queries to network devices, which then return the requested data.
SNMP Versions and Improvements
Over the years, SNMP has undergone several revisions to address security and functionality concerns. SNMPv1, the original version, had limited security features and was later replaced by SNMPv2c, which introduced community-based security. SNMPv3, the latest version, provides more robust security features, such as authentication and encryption, to protect against unauthorized access and tampering.
About Kentik: Kentik is a network intelligence and observability platform used by modern infrastructure teams to monitor, understand, and operate complex hybrid networks. By combining telemetry such as flow data, routing context, performance tests, and network monitoring metrics, Kentik helps teams pinpoint root cause faster and make better decisions about performance, cost, and security.
Learn how AI-powered insights help you predict issues, optimize performance, reduce costs, and enhance security.

Limitations of SNMP Performance Monitoring
Despite its widespread adoption, SNMP has some limitations. The protocol is primarily focused on monitoring and managing device-level information and doesn’t provide visibility into network traffic patterns. Additionally, SNMP’s polling-based approach can lead to performance issues in large, complex networks, as the management system must continuously poll devices for updates.
The Rise of Flow-Based Monitoring
Introduction to flow-based monitoring
In response to the limitations of SNMP, flow-based monitoring emerged as a more comprehensive solution for network visibility. Flow-based monitoring allows network administrators to analyze network traffic patterns and identify potential issues, such as congestion, latency, and security threats.
NetFlow, sFlow, and IPFIX: key protocols and differences
NetFlow, developed by Cisco, was the first flow-based monitoring protocol and has since become an industry standard. NetFlow captures detailed information about network traffic flows, including source and destination IP addresses, packet counts, and byte counts. sFlow, a competing protocol, takes a different approach by sampling packets at regular intervals to provide a statistical representation of network traffic. IPFIX, or IP Flow Information Export, is a more recent protocol that builds on the NetFlow concept and provides greater flexibility and extensibility.
Learn more about the various protocols used for network monitoring in “A Guide to Network Monitoring Protocols.”
Benefits of Flow-based Monitoring over SNMP
Flow-based monitoring offers several advantages over SNMP. First, it provides deeper visibility into network traffic patterns, enabling administrators to detect and troubleshoot issues more effectively. Second, flow-based monitoring is more scalable and efficient, as it doesn’t rely on continuous polling of devices. Finally, flow-based monitoring supports advanced analytics, allowing organizations to gain valuable insights into network performance, security, and user behavior.
Packet Capture and Deep Packet Inspection (DPI)
The Need for Packet-level Visibility
As networks grew more complex and security threats evolved, network administrators recognized the need for greater visibility into the data packets traversing their networks. Packet-level visibility provides insights into network performance, application usage, and potential security issues, enabling more informed decision-making and faster troubleshooting.
Packet Capture Techniques and Tools
Packet capture involves intercepting and storing data packets as they travel across a network. Several techniques and tools are available for packet capture, such as port mirroring, network taps, and specialized capture software like Wireshark. These tools allow administrators to capture and analyze packets in real-time or store them for later analysis.
Deep Packet Inspection: Analyzing Packet Content
Deep Packet Inspection (DPI) takes packet capture a step further by examining the contents of data packets, including headers, payloads, and application data. DPI can identify the applications generating traffic, detect security threats, and provide insights into user behavior. DPI is a powerful tool for network administrators, enabling them to monitor and optimize network performance, enforce policies, and improve security.
Use Cases and Benefits of DPI
DPI offers several benefits for network administrators, such as enhanced network visibility, improved security, and more efficient troubleshooting. DPI can be used for application-aware traffic shaping, Quality of Service (QoS) enforcement, and detecting security threats like malware, Distributed Denial of Service (DDoS) attacks, and data exfiltration. By providing deeper insights into network traffic, DPI enables administrators to make better-informed decisions and maintain a high level of network performance.
Network Performance Monitoring and Diagnostics (NPMD)
Beyond Basic Monitoring: The Rise of NPMD
As networks continued to evolve and become more complex, traditional monitoring tools like SNMP and flow-based monitoring struggled to keep up with the demands of modern network environments. In response, Network Performance Monitoring and Diagnostics (NPMD) solutions emerged, offering more comprehensive and advanced monitoring capabilities to help administrators effectively manage their networks.
Key Features of NPMD Solutions
NPMD solutions combine various monitoring techniques, such as SNMP, flow-based monitoring, packet capture, and DPI, to provide a holistic view of network performance. These solutions also incorporate advanced analytics, machine learning, and visualization features to help administrators quickly identify and resolve network issues. NPMD tools often include features like baselining, root cause analysis, and predictive analytics, enabling proactive network management — features that laid the groundwork for today’s network observability and network intelligence platforms.
The Role of NPMD in Modern Network Management
NPMD plays a critical role in modern network management, providing administrators with the tools and insights they need to maintain optimal network performance and address potential issues before they escalate. By offering a comprehensive view of network performance, NPMD solutions enable organizations to optimize their networks, improve application performance, and enhance the overall user experience. With the increasing reliance on networks for business-critical applications and services, NPMD has become an essential component of effective network management.
Network Observability and AI-Driven Monitoring
The Shift Towards Network Observability
As networks become increasingly complex and dynamic, traditional monitoring techniques struggle to provide the comprehensive visibility required for modern network management. Network observability has emerged as a critical approach to understanding and managing network performance, incorporating a broader range of data sources and analytics techniques to provide deeper insights into network behavior.
The Role of Telemetry Data and Analytics
Telemetry data, which includes network, cloud, host, and container flow data, as well as internet routing, performance tests, and network metrics, plays a crucial role in network observability. By collecting and analyzing this rich dataset, network administrators can gain a more accurate and nuanced understanding of their networks, helping them to identify performance issues, optimize resource usage, and maintain a high level of network performance.
This rich telemetry foundation is essential not just for network observability, but also for the next stage: network intelligence, where AI systems reason over this data on behalf of NetOps teams.
Learn more about the types of telemetry data involved in network observability in our blog post, “The Network Also Needs to be Observable, Part 3: Network Telemetry Types”.
AI-driven Monitoring: Machine Learning and Anomaly Detection
AI-driven monitoring leverages machine learning algorithms and advanced analytics to identify patterns, trends, and anomalies in network data. Within a modern network observability platform, these techniques help sift signal from noise—automatically detecting performance degradation, potential security threats, and traffic changes so teams can proactively address issues and maintain optimal network performance.
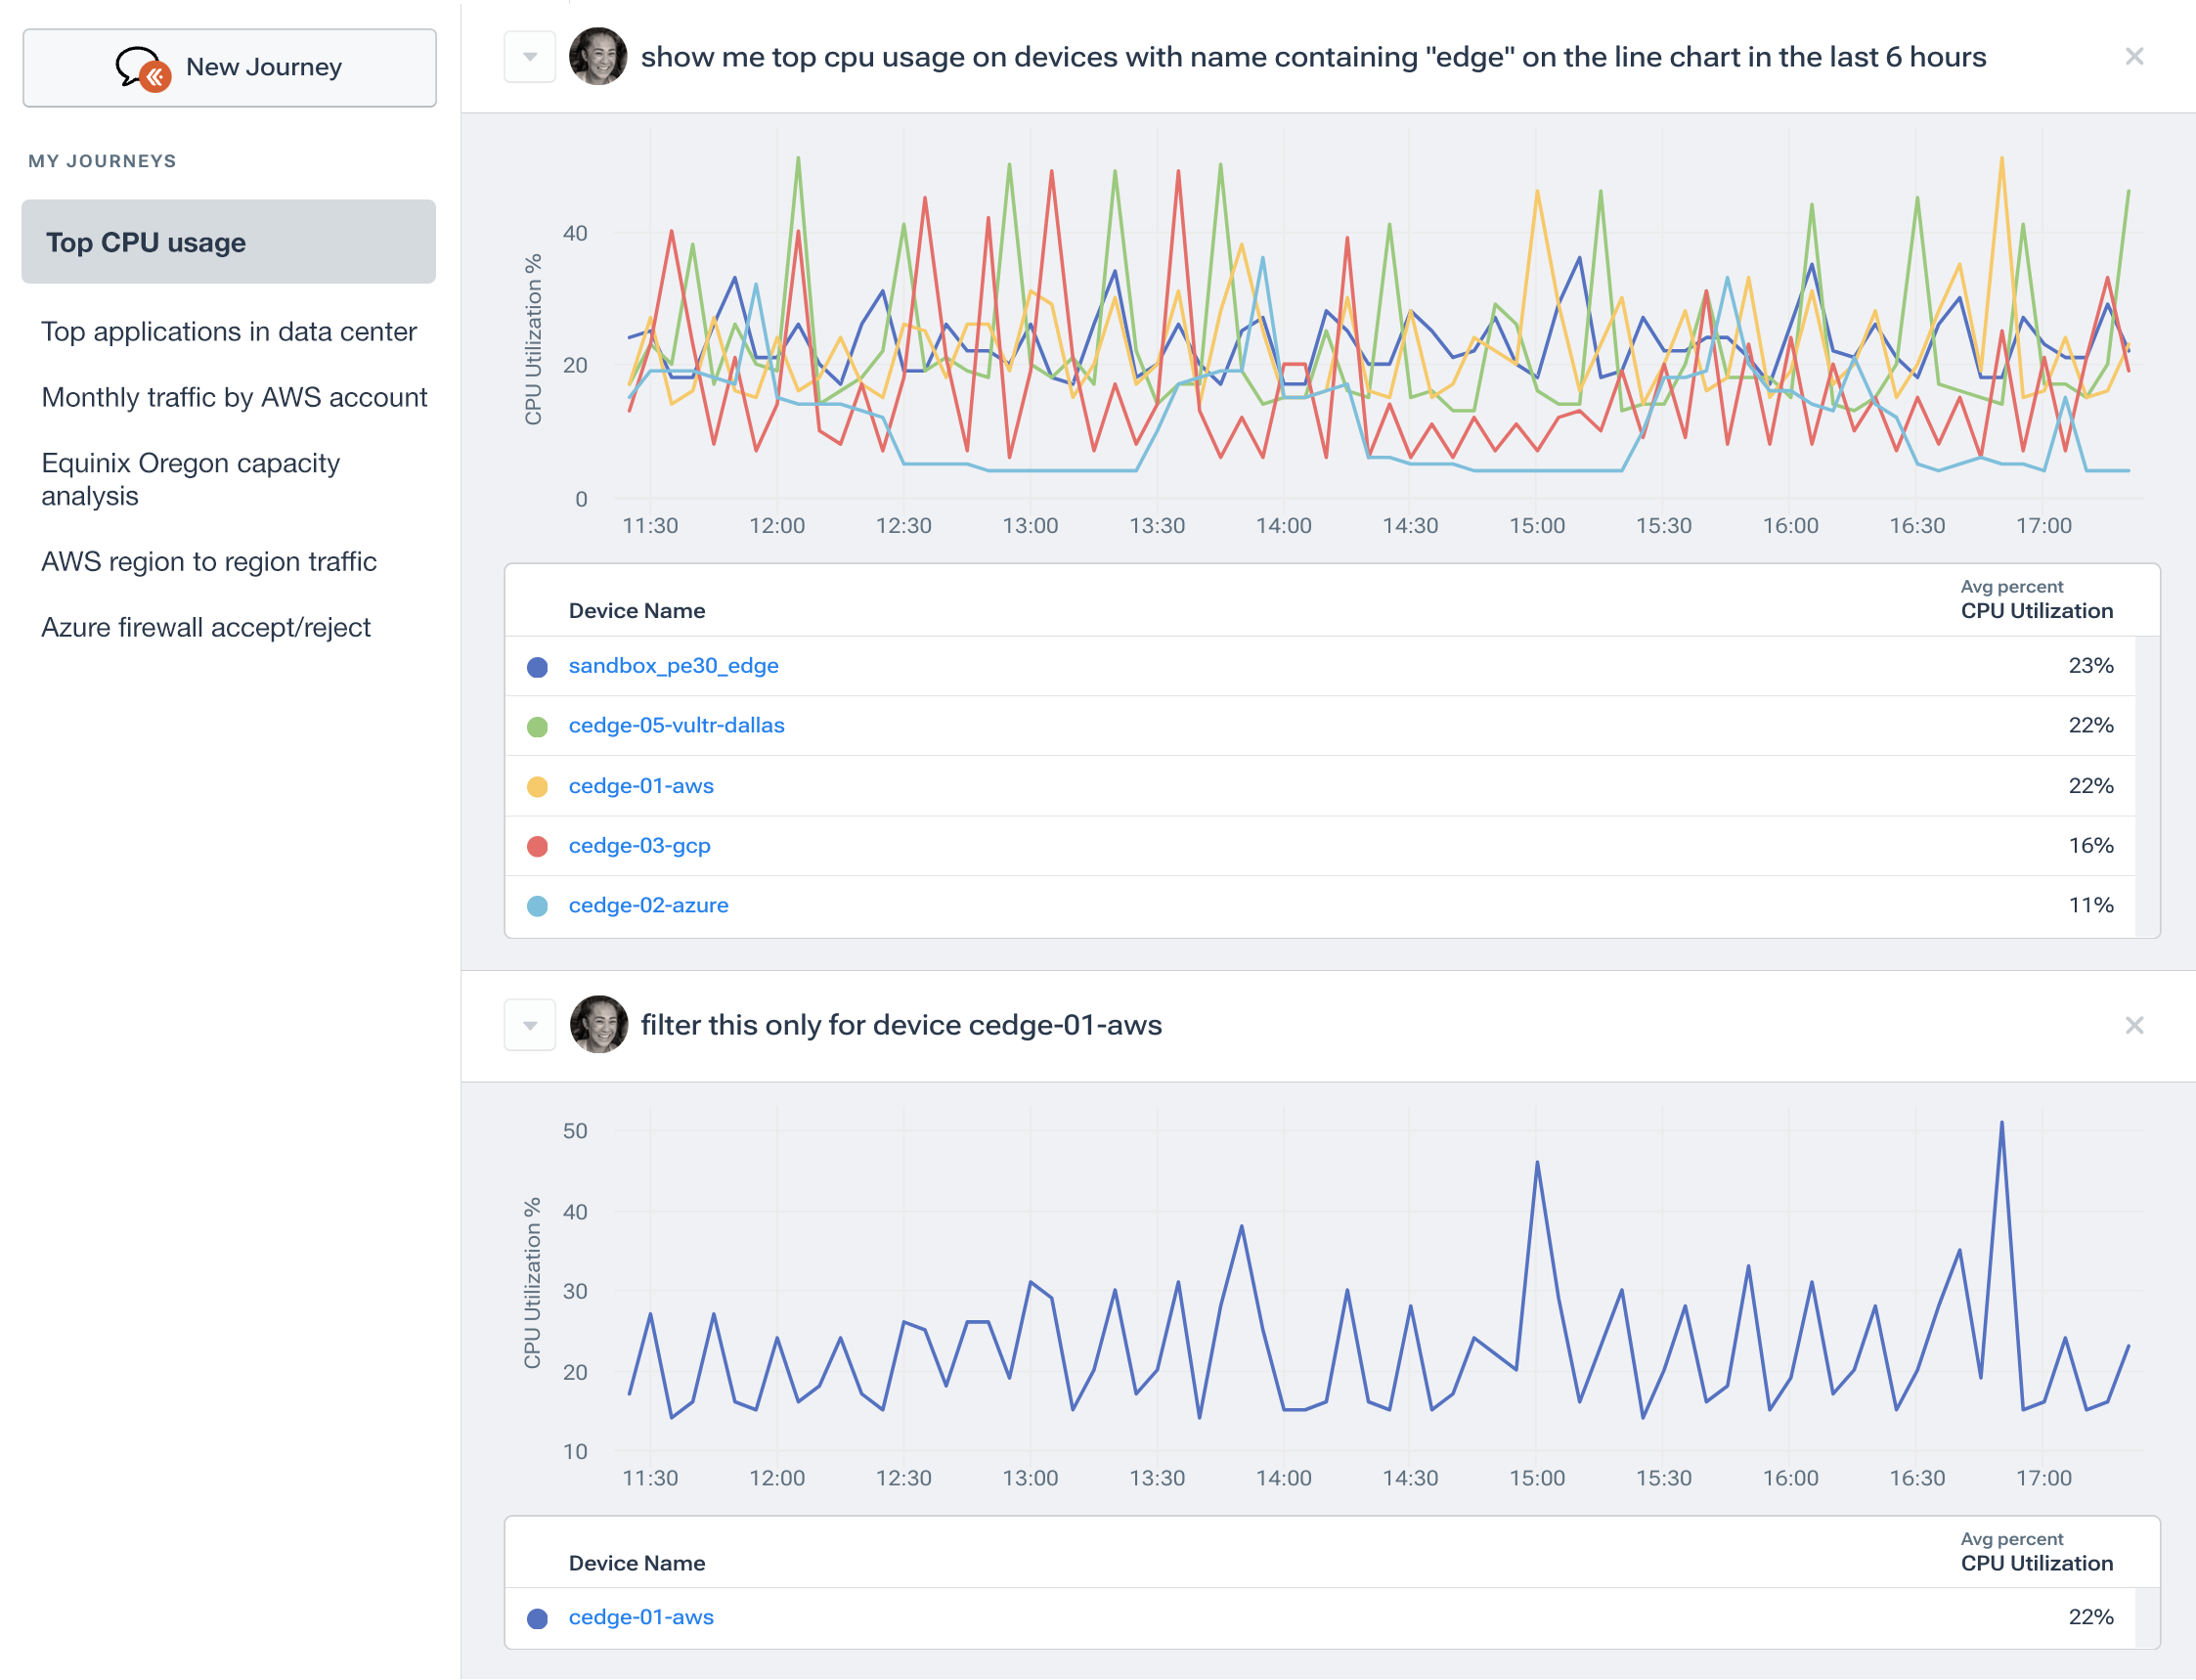
Recent advances in generative AI have already been incorporated into modern network monitoring systems such as Kentik NMS. Kentik AI allows NetOps professionals and non-experts alike to ask questions—and immediately get answers—about the current status or historical performance of their networks using natural language queries. This tool allows administrators to understand on-premises, hybrid, and multicloud networking environments from a single query engine. Because it combines network data from many protocols—including flow data, SNMP, streaming telemetry, containers, and cloud flow logs—Kentik AI enables unprecedented visibility into modern networks.

AI-driven monitoring and observability are necessary foundations, but on their own they still rely on humans to connect the dots. NetOps teams must manually correlate symptoms across data sources, map network behavior to applications and customers, and decide which actions to take. The next step in this evolution is network intelligence: using AI not just to surface more insights, but to reason over telemetry, tie it to business context, and help recommend—or even trigger—actions.
Benefits of AI-driven Network Monitoring
AI-driven network monitoring offers several key benefits for network administrators, including faster identification of issues, more accurate root cause analysis, and the ability to predict and prevent future network problems. By providing deeper insights and automating aspects of network management, AI-driven monitoring helps organizations optimize their networks, improve application performance, and enhance user experiences.
These benefits become even more powerful when AI-driven monitoring is part of a broader network intelligence architecture, where unified, contextual telemetry and advanced AI work together to explain what is happening, why it is happening, who is impacted, and what should happen next.
From Network Observability to Network Intelligence
Network observability was a major step forward from traditional monitoring. By unifying telemetry from devices, traffic, applications, and cloud platforms, observability platforms gave NetOps teams the ability to explore almost any question about what was happening in the network. Dashboards, correlations, and flexible queries made raw data more usable and reduced the time it took to see problems.
But as networks and telemetry sources multiplied, even observability reached its limits. Teams found themselves surrounded by more dashboards, more alerts, and more data than any human could reasonably analyze. The challenge was no longer seeing what was happening. It was understanding why it was happening, who or what was impacted, and what to do next—quickly and consistently.
That’s where network intelligence comes in. Network intelligence builds on observability by adding three key capabilities:
-
A unified, contextual data foundation: Telemetry from flows, routing, SNMP and streaming telemetry, cloud and container platforms, synthetic tests, and logs is collected into a single data engine and enriched with business and service context (applications, customers, locations, costs, and more). Instead of isolated metrics, teams see how network behavior maps to real services and users.
-
An AI-assisted reasoning layer: Modern AI and machine learning models learn baselines, detect anomalies, and correlate symptoms across data types. Rather than just indicating that an interface is congested, a network intelligence platform can explain which applications and customers are affected, suggest likely root causes, and estimate the risk to SLAs or critical workloads.
-
Guidance and action, not just visibility: Network intelligence moves beyond “data utility” to decision support. It answers not only “what is happening?” but also “why is it happening?”, “how bad is it?”, and “what should we do now?” In many cases, it can generate recommended next steps or trigger automated workflows under well-defined guardrails.
The next stage of this evolution is the rise of agentic networks. In an agentic model, AI assistants do more than raise alerts or annotate dashboards. They can plan and execute multi-step investigations, run targeted queries, test hypotheses, and even initiate changes—such as opening tickets, adjusting thresholds, or coordinating with automation systems—while keeping humans in control. Instead of simply automating repetitive tasks, agentic AI helps encode and scale the expertise of experienced network engineers.
Network intelligence is the logical successor to network observability. Each prior stage in this evolution expanded what we could see and measure. Network intelligence adds the ability to reason over that telemetry at scale, turning a rich data foundation into explanations, predictions, and actions that help NetOps teams design, operate, and protect modern networks.
What NetOps Professionals Should Know about Network Observability and Network Intelligence
NetOps professionals should be aware of several key developments and trends that have shaped the evolution of network monitoring solutions, moving from simple monitoring tools to advanced network intelligence platforms like Kentik:
-
The importance of data integration: Modern network observability solutions can ingest and correlate data from a wide variety of sources, such as network devices, cloud infrastructure, applications, and security tools. This integration provides a more comprehensive understanding of network performance, security, and user experience, enabling NetOps professionals to make better-informed decisions.
-
Proactive monitoring and automation: Traditional network monitoring tools often focused on reactive troubleshooting, whereas advanced network observability platforms emphasize proactive monitoring and automated issue resolution. This helps NetOps professionals detect and resolve issues before they impact network performance or user experience.
-
Customizable dashboards and visualization: Advanced network observability platforms offer customizable dashboards and data visualization tools, allowing NetOps professionals to create personalized views of network performance and quickly identify trends or anomalies. This enables faster and more effective decision-making.
-
Integration with DevOps and SRE practices: As organizations increasingly adopt DevOps and Site Reliability Engineering (SRE) practices, network observability platforms have evolved to integrate with these methodologies, providing network performance insights that support continuous deployment, incident management, and service level objectives (SLOs).
-
Scalability and flexibility: Modern network observability solutions are designed to scale with the growing complexity and size of networks, including multicloud and hybrid environments. This ensures that NetOps professionals can maintain visibility and control over their networks, even as they evolve and expand.
-
Focus on security and compliance: Advanced network observability platforms often include features that support security monitoring and compliance, such as anomaly detection, traffic pattern analysis, and integration with security information and event management (SIEM) systems. This helps NetOps professionals maintain the security and compliance posture of their networks.
-
From observability to network intelligence: NetOps teams should look for platforms that can reason over telemetry, not just visualize it. Network intelligence solutions offer contextualized views, recommendation engines, and AI-assisted workflows that can suggest root cause and remediation.
-
The age of agentic NetOps is here: The next step is agentic AI that can operate observability tools on the NetOps team’s behalf, automating expertise instead of just repetitive tasks.
By staying informed about these developments and trends, NetOps professionals can ensure that they are well-equipped to manage the evolving challenges of modern networks and leverage the full potential of advanced network observability and intelligence solutions like Kentik.
How Kentik Can Help
Kentik is a leading network observability and network intelligence platform that enables organizations to gain complete visibility into their networks and turn that visibility into guided action. Here’s how Kentik can help your organization:
Build the observability foundation:
- See All Networks: Kentik provides network data from data centers, edge, cloud, and internet, giving you comprehensive visibility wherever your traffic goes.
- Collect All Telemetry: Kentik gathers network, cloud, host, and container flow data, internet routing, performance tests, and network metrics to provide a complete view of your network.
- Query with Context: Kentik enriches network data with information about infrastructure, applications, users, customers, geo, policies, routing, and more.
Add network intelligence and action on top:
- Get Insights: Kentik delivers AI-driven insights, enabling you to detect degrading performance, possible attacks, and traffic changes early, helping you stay ahead of potential issues.
- Ask Anything: Kentik allows you to ask any question about your network and receive answers quickly, with powerful querying, filtering, visualization, and natural language capabilities.
- Take Action: Kentik serves as your go-to solution for planning, running, and fixing your network, using AI-assisted workflows and integrations so you can move from detection to remediation with confidence.
Together, these capabilities form the Kentik Network Intelligence Platform: observability data in, AI-assisted insights and actions out.
Kentik offers a suite of advanced network monitoring solutions designed for today’s complex, multicloud network environments. The Kentik Network Intelligence Platform empowers network pros to monitor, run, and troubleshoot all of their networks, from on-premises to the cloud. Kentik’s network monitoring solution addresses all three pillars of modern network monitoring, delivering visibility into network flow, powerful synthetic testing capabilities, and Kentik NMS, the next-generation network monitoring system.
To see how Kentik can bring the benefits of network intelligence to your organization, request a demo or sign up for a free trial today.
From SNMP-based device monitoring to flow-based analysis and DPI, from NPMD to modern network observability platforms, each stage in the evolution of network monitoring has expanded what NetOps teams can see and measure. The next stage is network intelligence. Unifying rich telemetry, adding business and service context, and applying advanced AI helps teams understand what is happening, why it is happening, who is impacted, and what to do next. Network intelligence doesn’t replace earlier monitoring technologies—it unlocks their full value.
Related Kentik Articles on Observability
- What is Observability? An Overview
- What is Network Observability?
- The Role of Network Observability in Modern Application Performance Management
Related Kentik Articles on Network Intelligence
- AI Networking 101: How AI Runs Networks and Networks Run AI
- Network Intelligence: 10 Critical Use Cases
- Beyond Observability: Why Network Intelligence Will Make Traditional Network Management Obsolete
- From Observability to Network Intelligence: How Kentik Built the Foundation for Networks That Think
- Beyond Automation: The Rise of Agentic Networks


