Summary
When something goes wrong with a service, engineers need much more than legacy network visibility to get a complete picture of the problem. Here’s how synthetic monitoring helps.
Nobody actually cares about the network. Provocative words coming from a network visibility company, you might be thinking. However, consider what you’re doing right now. You’re reading a blog on a website, maybe clicking around other tabs, possibly streaming some music, and likely keeping an eye on your work chat. These are all applications, and that’s what we all truly care about, not the plumbing that delivers them.
So when something goes wrong with a service we’re delivering to our customers, usually an application, engineers need much more than legacy network visibility information to get a complete picture of the problem. Interface statistics we get from SNMP help, and so does path information we get from flow data and routing tables. There’s definitely a good amount to gather from these methods, but engineers need the big picture.
Putting things in context
The context of those interface statistics, flow logs, and routing tables or, in other words, the context of visibility, is the application — and that’s the point of network observability. That means fixing a routing problem isn’t just an exercise in making the network hum again — it’s to get back to delivering optimally performing applications to customers as soon as possible and without any more interruptions.
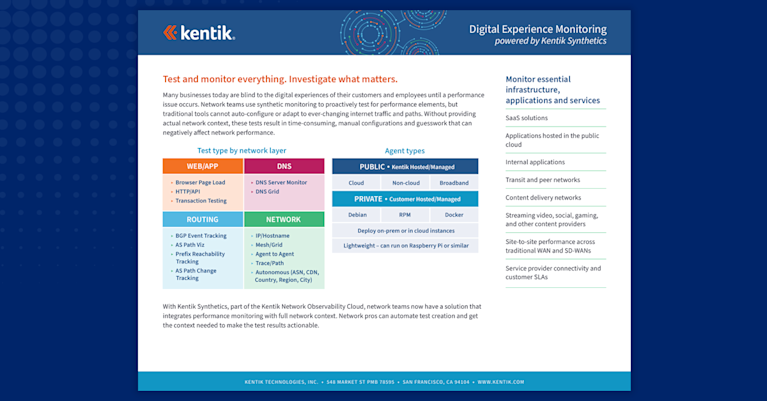
Synthetics, sometimes referred to as synthetic testing or synthetic monitoring, provides more specific application-focused visibility information than traditional MELT. Using synthetics, you can learn about an application’s page-load time, you can simulate a person logging into a website, or you can monitor specific SaaS application performance.
A synthetic test is a way to generate traffic artificially to analyze a specific problem. That can be something very simple like pinging application servers to monitor availability. They can also be network-focused, such as monitoring BGP peerings in a geographic region. But the real power is when synthetic testing is application-focused, such as monitoring how long it takes for an application server to respond to a request, or simulating a person logging into an ecommerce site to make a purchase.
Imagine trying to figure out why your car isn’t running well. It’s making a funny sound and it doesn’t drive smoothly. There’s a check-engine light to tell you there’s a general problem with the engine. There’s a dashboard indicator to tell you that you’re low on fuel. And in some cars there’s even an alert that your tires are low on air.
But why is the car running poorly? Those few monitoring systems give us some helpful information, but it’s not until a mechanic test drives the car and runs specific and deliberate diagnostic tests when we can understand what the underlying problem is.
The big picture
Since synthetic testing gives you greater context for your other metrics, it’s part of an overall visibility solution, not simply a feature you bolt on and forget about. Traffic flow data, device information, cloud logs, and routing tables are all very important and each provide their own specific value. Synthetics then adds the context missing from simply looking at routing tables and cloud logs.
For example, picture a poorly running application hosted in AWS and load-balanced across several regions. Your traditional network visibility information alerts you that the inbound interfaces on all but one AWS region are maxed out. As a result, all traffic is being redirected to one AWS region. Now you know there’s a problem, and you have a place to start troubleshooting.
But just like the mechanic running diagnostics on your car, synthetics is powerful for troubleshooting to help you understand why you’re getting those alerts. Using Kentik Synthetics, you can simulate a person logging into the application, see the DNS request and response, the application’s response time, and trace the traffic path. Then you can discover that DNS responses for the application are directing everyone to a single region causing the application to feel slow.
In a real-life network there would be more digging to do here, but this is an example of the application-specific visibility that gives flow data, cloud logs, and mundane information like interface statistics context so it all comes together.
Whether it’s as simple as a ping test to check availability of a resource or a complex test to simulate a person making a purchase on an ecommerce site, Kentik Synthetics provides a programmatic and deliberate method for getting beyond the alert and understanding why something is going on. Kentik Synthetics helps us focus on what we truly care about — the big picture.
Want to learn more? Start a 30-day trial and give Kentik Synthetics a try.


