The Network Impact on Job Completion Time in AI Model Training

Summary
In large-scale AI model training, network performance is no longer a supporting actor — it’s center stage. Job Completion Time (JCT), the key metric for measuring training efficiency, is heavily influenced by the network interconnecting thousands of GPUs. In this post, learn why JCT matters, how microbursts and GPU synchronization delays inflate it, and how platforms like Kentik give network engineers the visibility and intelligence they need to keep training jobs on schedule.
Training a modern large language model (LLM) isn’t a single-node exercise. A state-of-the-art model may involve tens of thousands of GPUs spread across dozens of racks, interconnected by several tiers of network switches, and orchestrated by a scheduler that ensures predictable performance. In this environment, the metric that ultimately governs cost, competitiveness, and time-to-market is job completion time, also known as JCT.
Think of JCT as the duration between the moment a training job is admitted to the GPU cluster and the moment the final checkpoint is written at the end of a training run. There are a variety of factors that affect JCT, not least of which is the network connecting those tens of thousands of GPUs. It goes without saying that for network engineers and architects building and operating AI data centers, understanding and optimizing the JCT has become a new core responsibility.
However, as these clusters scale beyond hundreds of GPUs, network performance becomes an increasingly limiting factor.
What is Job Completion Time?
JCT is sometimes conflated with raw compute throughput, but for distributed AI workloads, it’s a composite metric that depends on four tightly coupled subsystems:
- Compute efficiency, which refers to GPU utilization and tensor-core occupancy.
- Storage throughput, or the ability to pre-fetch batched data or checkpoints.
- Cluster orchestration is how effectively the scheduler bins jobs, stages data, and handles failures.
- Data center network performance encompasses end-to-end latency, congestion, path diversity, and microburst tolerance for both east-west traffic and storage uplinks.
A slowdown in any one layer can adversely affect JCT, and it’s estimated that when breaking down the activities during training in large-scale deployments, 50% or more of JCT is spent on time packets being processed and traversing the network. This means that, in practice, networking dominates JCT, especially when GPU clusters grow beyond a few hundred.
Why the network dominates JCT in large-scale training
The slowest link
Deep learning frameworks, which are commonly used in LLMs, use various mechanisms to synchronize gradients on every iteration. In this context, a gradient refers to the partial derivatives of the loss function concerning the model’s parameters (like weights and biases). Gradients indicate the degree to which each parameter must change to minimize the model’s error and are calculated using backpropagation. In large models, this process is synchronized across multiple GPUs, therefore relying heavily on the underlying network.
Therefore, the time to complete each operation scales with the slowest link in the path. Even a transient 1ms microburst can stall an iteration and create a cascade delay that multiplies across millions of steps.
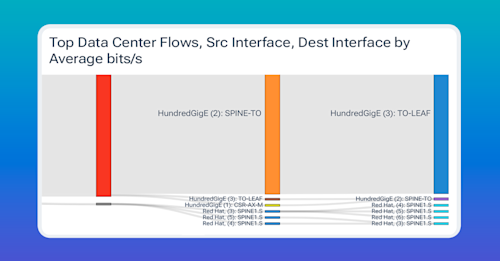
In the image below, notice we can trace the path between GPUs (or clusters) and identify where there is any packet loss, latency, jitter, etc. In most designs, the goal is to minimize the number of hops as much as possible. However, the number of hops is not zero, especially when tracing the path between GPUs and a storage network.

And because model training often shards a single neural network across multiple GPUs, each layer in the deep learning network can’t advance until upstream activations arrive. This means that inter-GPU network latency becomes as important as FLOPS, or Floating-Point Operations Per Second, which is a measure of a computer’s performance with regard to mathematical calculations on floating-point numbers.
For example, a 5µs increase in average hop latency across a 64-GPU slice can add hours to a multi-week run. In other words, seemingly tiny delays can compound exponentially.
GPU stragglers
Schedulers typically wait for all GPU clusters, also referred to as workers, to commit the current epoch before launching the next. If one rack of GPUs experiences congestion, it increases the delay between the fastest and slowest workers, resulting in cluster-wide idle time. In cloud deployments, this also directly impacts OPEX, as we would still be billed for GPUs regardless of whether they’re idling or not.
Checkpoint delays
LLM training pipelines checkpoint every few hours and frequently perform validation passes. These operations create IO storms that generate traffic between storage and compute fabrics. If there’s any buffering or queue buildup, the training job could be throttled, potentially impacting every tenant in the fabric.
The role of network intelligence
Traditional SNMP counters and switch ASIC metrics reveal device health, but they do not expose the relationship between network behavior and JCT. Network intelligence, which refers to the continuous, context-rich analysis of flow, routing, telemetry, and synthetic test data, bridges that gap. For AI training clusters, a network-intelligence platform answers questions such as:
- Which resource groups experienced tail-latency spikes during the last 30 minutes?
Did congestion-control ECN marks correlate with a drop in GPU utilization on job 42?
-
Which leaf-spine paths carried the checkpoint burst at 14:06, and did they share buffers with another tenant?
-
How many TCP retransmits occurred on RoCEv2 flows tagged to the “pre-training” namespace?
-
Are DirectConnect or cloud inter-VPC gateways adding unpredictable RTT during off-cluster evaluation phases?
With these kinds of insights, network engineers can decide whether to adjust RDMA buffer thresholds, re-balance ECMP hashing, pin critical ranks to dedicated uplinks, or simply re-provision more bandwidth.
Instrumentation requirements for accurate JCT diagnosis
To accurately diagnose JCT issues in AI training workloads, we need several types of instrumentation. First, high-resolution flow telemetry is necessary to capture short bursts of traffic that occur during each training iteration. Additionally, line-rate streaming counters, such as queue occupancy, PFC pause events, and ECN marks exported by ASICs, help detect congestion before packets are dropped.
It’s also important to have visibility into the network topology. Training frameworks often label traffic with identifiers like Kubernetes namespaces, job IDs, or RDMA Queue Pair numbers. These need to be mapped to VLANs, VRFs, and physical links to understand where traffic is flowing.
We can also use synthetic probes to measure baseline latency and bandwidth between idle worker nodes without interfering with active jobs. Additionally, diagnosing JCT problems typically involves correlating metrics across multiple layers. For example, drops in GPU utilization, changes in storage throughput, and rising switch buffer levels must be analyzed together to identify the root cause and apply fixes in real time.
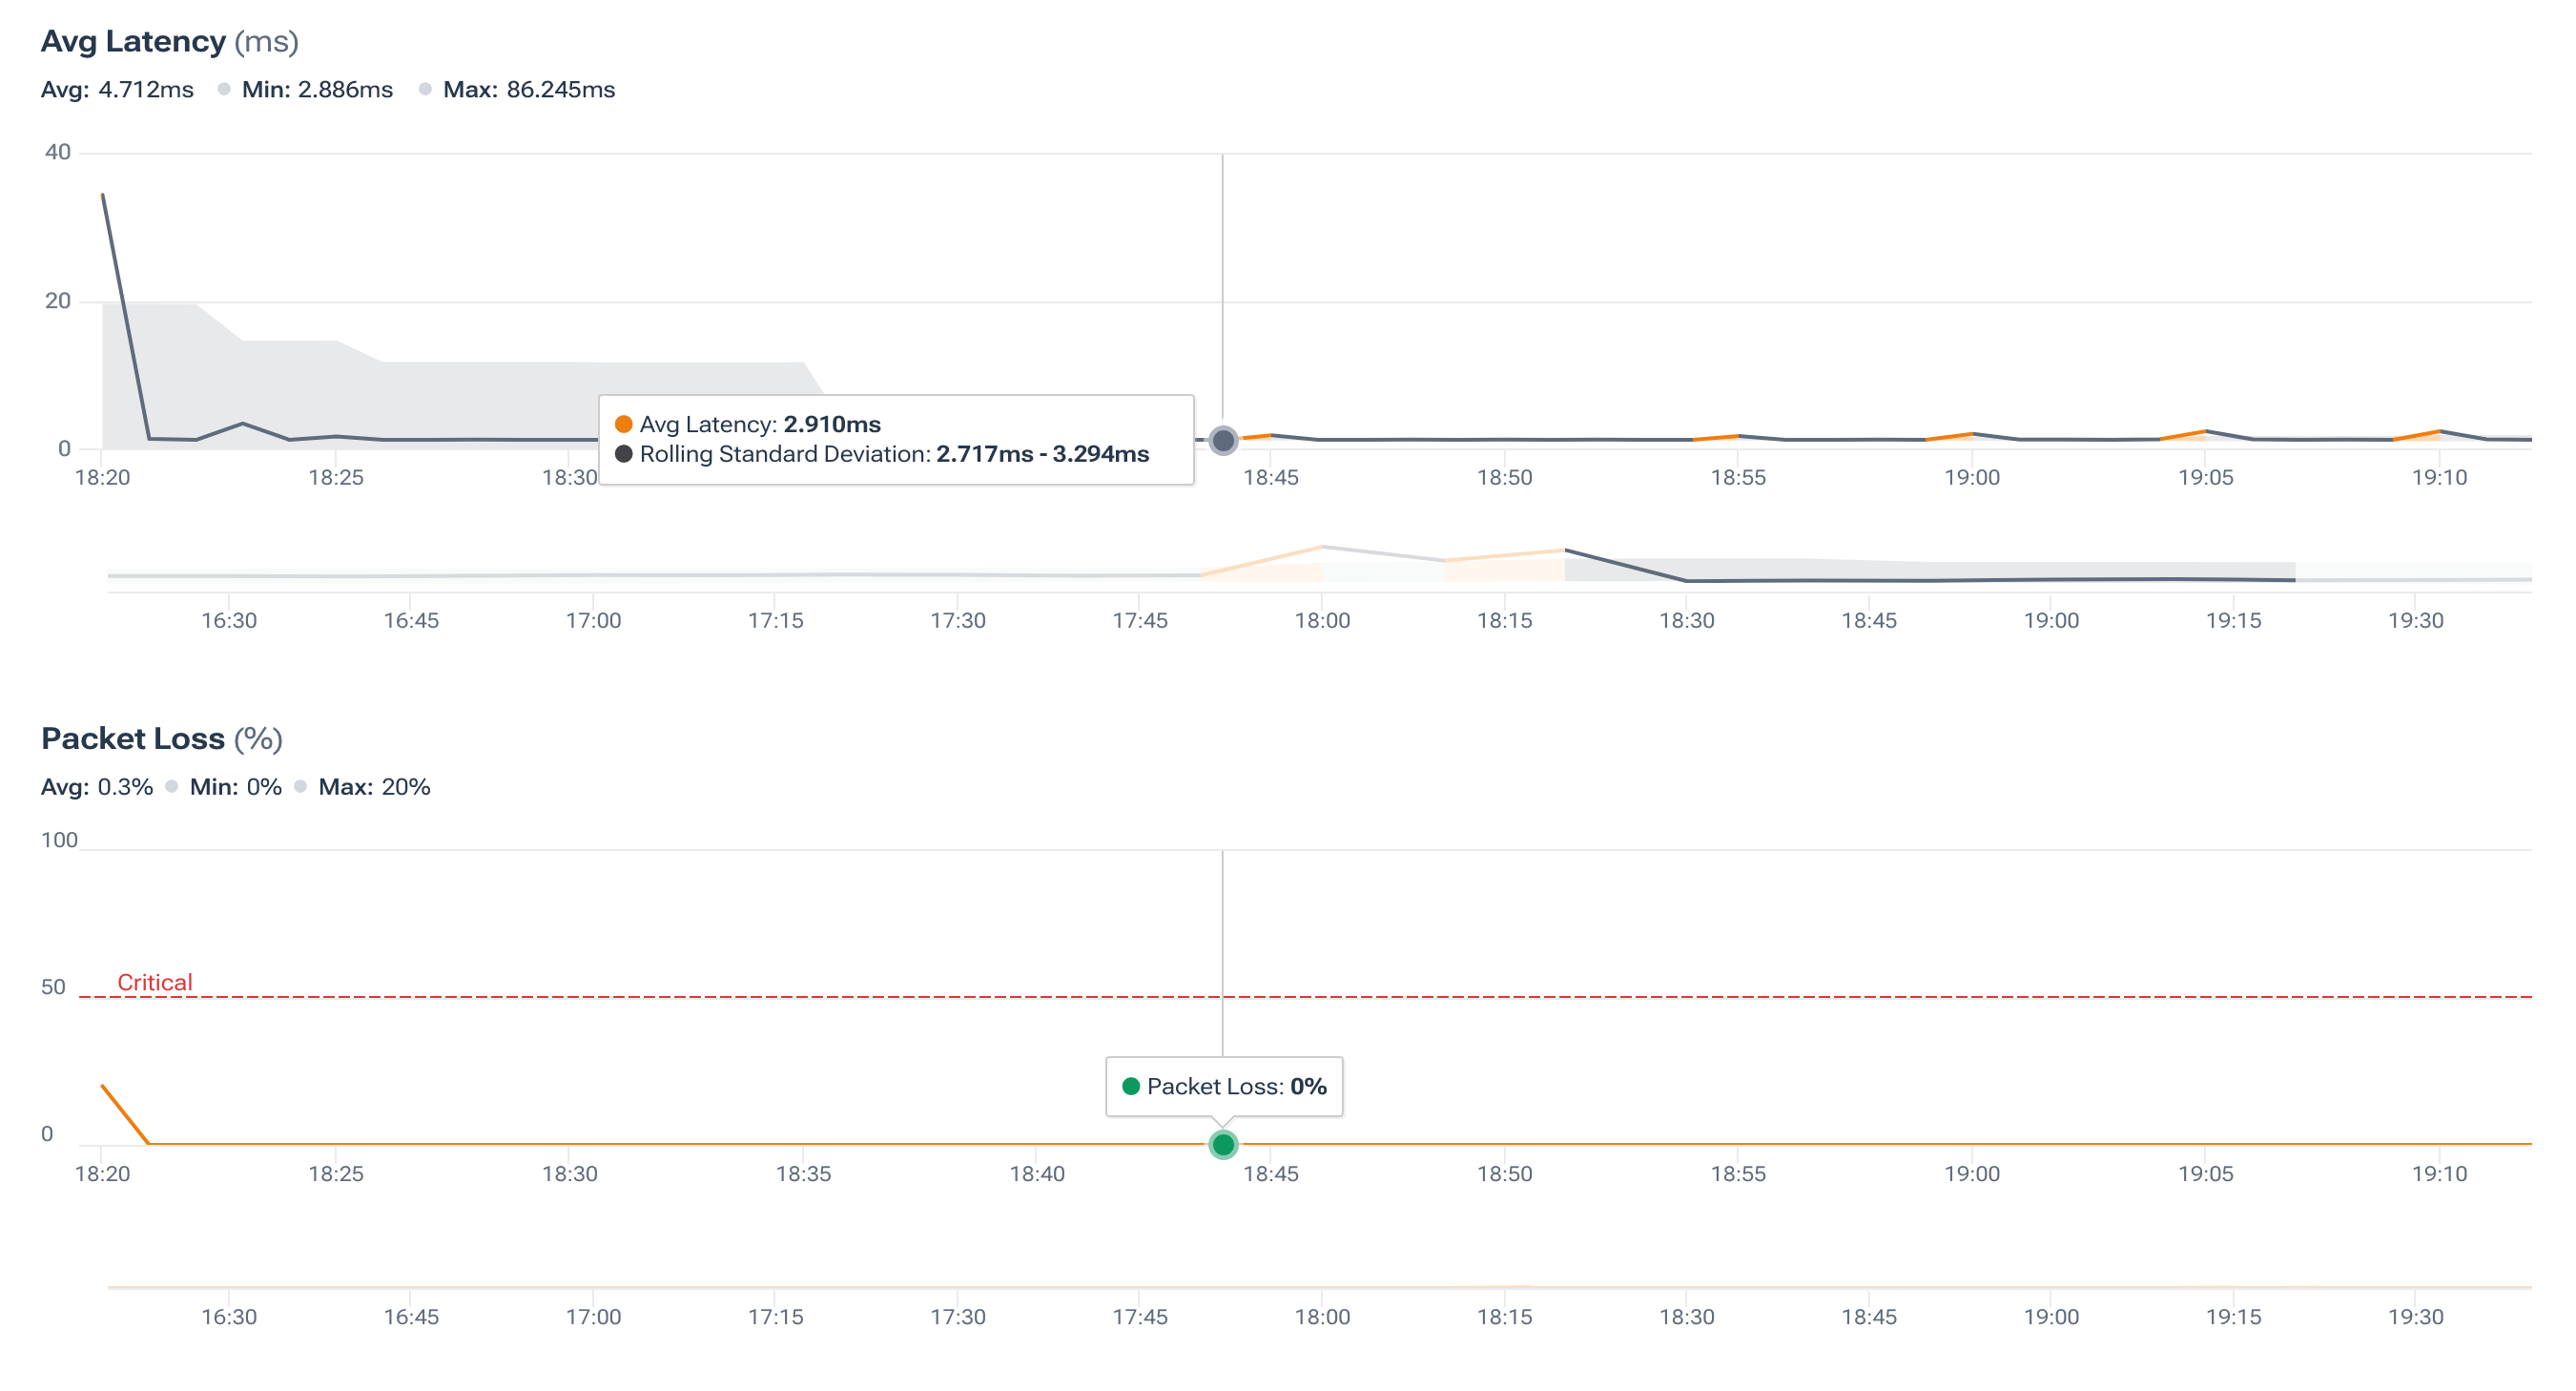
In the next image, notice that we can correlate latency and packet loss in a time-series also based on a rolling standard deviation. This way, we can understand in real-time the baseline metrics for our network as well as generate alerts directly from the system.
How Kentik delivers network intelligence for AI training
Kentik ingests cloud flow information such as AWS VPC and Azure VNet flow logs, as well as sFlow/IPFIX, SNMP, gNMI, and the results of synthetic tests. This data is then enriched with context such as pod labels, job IDs, VXLAN fabric topology, and so on, so network teams can visualize AI workloads end-to-end.
-
With Kentik, engineers can build real-time congestion visualizations that spotlight hot links during GPU communication and synchronization. Additionally, we can identify high round-trip times for RDMA flow groups, which could induce job delays.
-
With synthetic testing, engineers can proactively monitor the data center fabric to baseline and benchmark link utilization, path selection, and other key metrics.
-
Streaming telemetry provides critical real-time telemetry, including packet drops, CPU and memory utilization, buffer overflows, and relevant information to keep JCT as low as possible.
-
Kentik’s automated anomaly detection learns normal flow patterns and alerts when traffic patterns deviate from the norm.
-
Kentik helps engineers tie inter-AZ traffic and WAN egress fees back to specific training jobs, enabling data-science teams to balance JCT targets against budget.
Job completion time is the definitive KPI for AI training clusters. While compute horsepower certainly grabs headlines, the data center network often decides whether a model converges in a few days or a few weeks, and whether your organization hits its release window or exceeds its budget.
Data center network engineers are uniquely positioned to influence JCT through capacity planning, traffic engineering, and real-time diagnostics. By deploying a network intelligence platform such as Kentik, teams gain the granular, context-rich insight necessary to pinpoint (and eliminate) the bottlenecks that inflate training duration. In a market where every hour of GPU time translates into dollars and competitive advantage, shaving even single-digit percentages off JCT can yield significant returns.
