Summary
In this post we will show how to leverage Kentik Labs’ open source project ktranslate to bring network observability into the Sumo Logic platform.
Recently we caught up with the Sumo Logic team to discuss network visibility and optimizing application stack views. We took a look at their API and found that it would be easiest to use the HTTP Ingest method to send in our metric data.
Format
Sumo Logic offers a few different formats in which to ingest metrics. We chose the Carbon 2.0 format as it is relatively simple, yet offers enough flexibility to handle various additional enriched data that we augment the network flow with, such as ASN, geographical source/destination, protocols, etc. By leveraging the extensible design of ktranslate we created a new Carbon 2.0 output formatter that looks like the following:
metric=in_bytes mtype=rate unit=B/s  device_id=100 Type=kflow
dst_addr=192.168.5.15 src_endpoint=216.176.96.90:8080
src_addr=216.176.96.90 sample_rate=1 eventType=KFlow
dst_endpoint=192.168.5.15:52454 protocol=TCP
provider=kentik-flow-device src_as_name=RTCCOM
dst_route_prefix=0.0.0.0 input_port=54429 src_route_prefix=0.0.0.0
src_geo=US src_as=14574 l4_src_port=8080 l4_dst_port=52454
tcp_flags=27 dst_as_name=0 355 1655310976
By using the Carbon intrinsic tags such as the “mtype” and “unit” we can get rich data views from within Sumo Logic. We also add our enriched data using meta tags that enable better queries and filters from within Sumo Logic.
Sumo Logic
Once we had the format ready it was pretty straightforward to send the data to the Sumo Logic API using the ktranslate HTTP exporter. We needed to have the Sumo Logic API hosted collector endpoint and we were good to go. Here is an example:
$> ktranslate \
     --sinks http \
     --http_url   "https://endpoint4.collection.sumologic.com/receiver/v1/http/
<your-private-endpoint-here>" \
     --http_header "Content-Type:application/vnd.sumologic.carbon2" \
     --format carbon
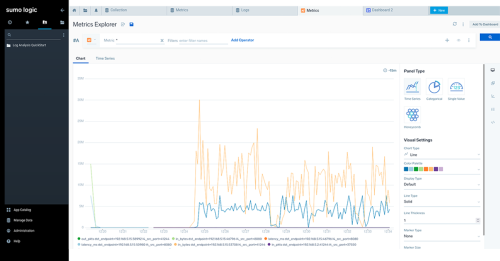
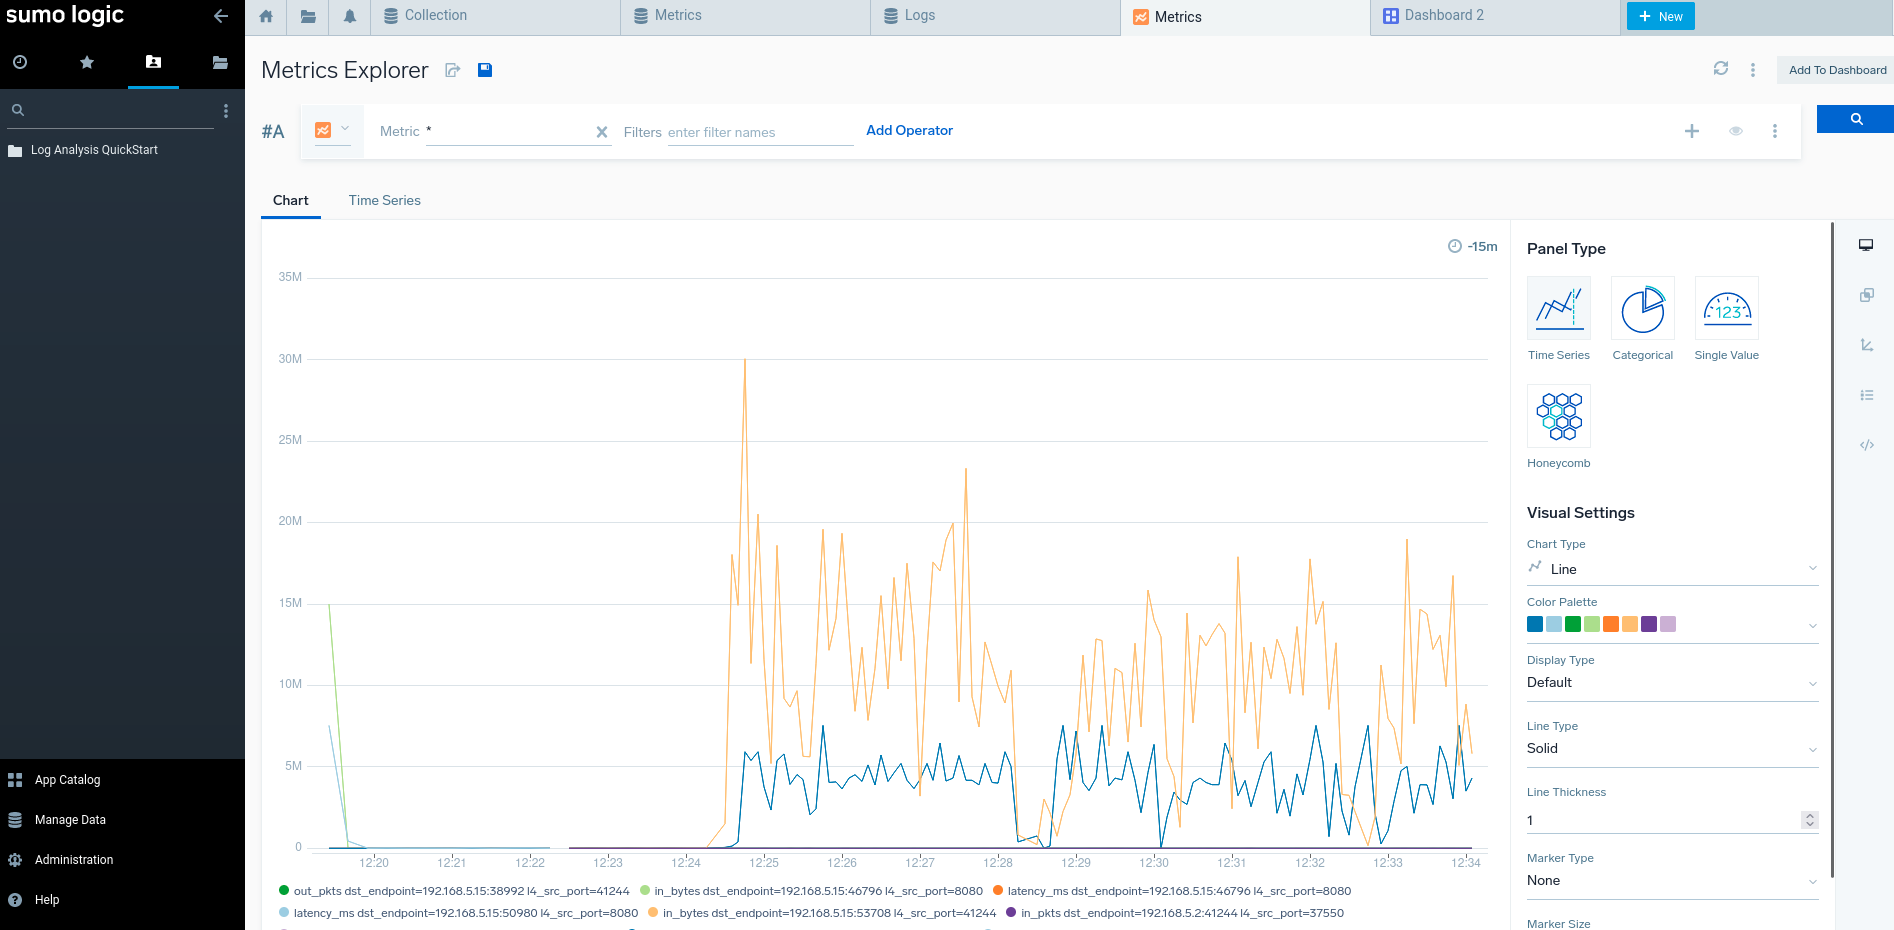
Once we have ktranslate sending metrics we should be able to see them on the Sumo Logic “Metrics” view:

We can then build a simple dashboard showing network data such as source and destination transfer:

By using ktranslate and kprobe we can get vital network metrics into a variety of services. If you have questions or comments please join us on Discord or GitHub.


