Identifying Idle Paths in a Data Center Leaf-Spine Fabric

Summary
In leaf-spine data center networks, traffic often becomes imbalanced, leaving some uplinks idle and resulting in wasted bandwidth. Kentik helps engineers identify underutilized paths, diagnose the causes, and take corrective action using enriched telemetry, visual topology maps, and intelligent alerts, turning hidden inefficiencies into actionable insights.
A well-designed leaf-spine topology distributes traffic across many links, but in real life, those links rarely share the traffic load equally. Hot spots form on a few spines, while others sit almost idle, leaving expensive bandwidth unused and forcing premature upgrades. This risks performance issues if sudden surges lead to congestion on already oversubscribed links. Kentik’s network intelligence platform gives network engineers a data-driven way to find those idle paths, understand why they’re idle, and use the answer to inform a new routing policy or subscription ratio architecture.
I made a short video discussing this common data center networking challenge:
… but read on to learn more about how Kentik can help. (And you can find more quick overviews like this in our Kentik Bytes video series.)
Mapping the fabric
Kentik starts by ingesting high-resolution flow records (NetFlow, sFlow, IPFIX), SNMP counters, BGP tables, and, in many organizations, gNMI-streamed interface stats from both leaf and spine switches. During ingest, the Kentik Data Engine enriches this data with information such as the role of each leaf or spine in the architecture, which is taken from LLDP and user-defined labels.
A visual representation of the fabric is generated in the Kentik Map as a tiered graph, with leaves at the bottom and spines at the top. Every 25 Gbps or 100 Gbps uplink is shown as an edge. In the graphic below, you can see a representation of our Dallas data center, featuring ToR switches at the bottom and spine and super-spine switches above. Hovering over each element provides the ability to dig deeper into the device details, topology, or the specific connections
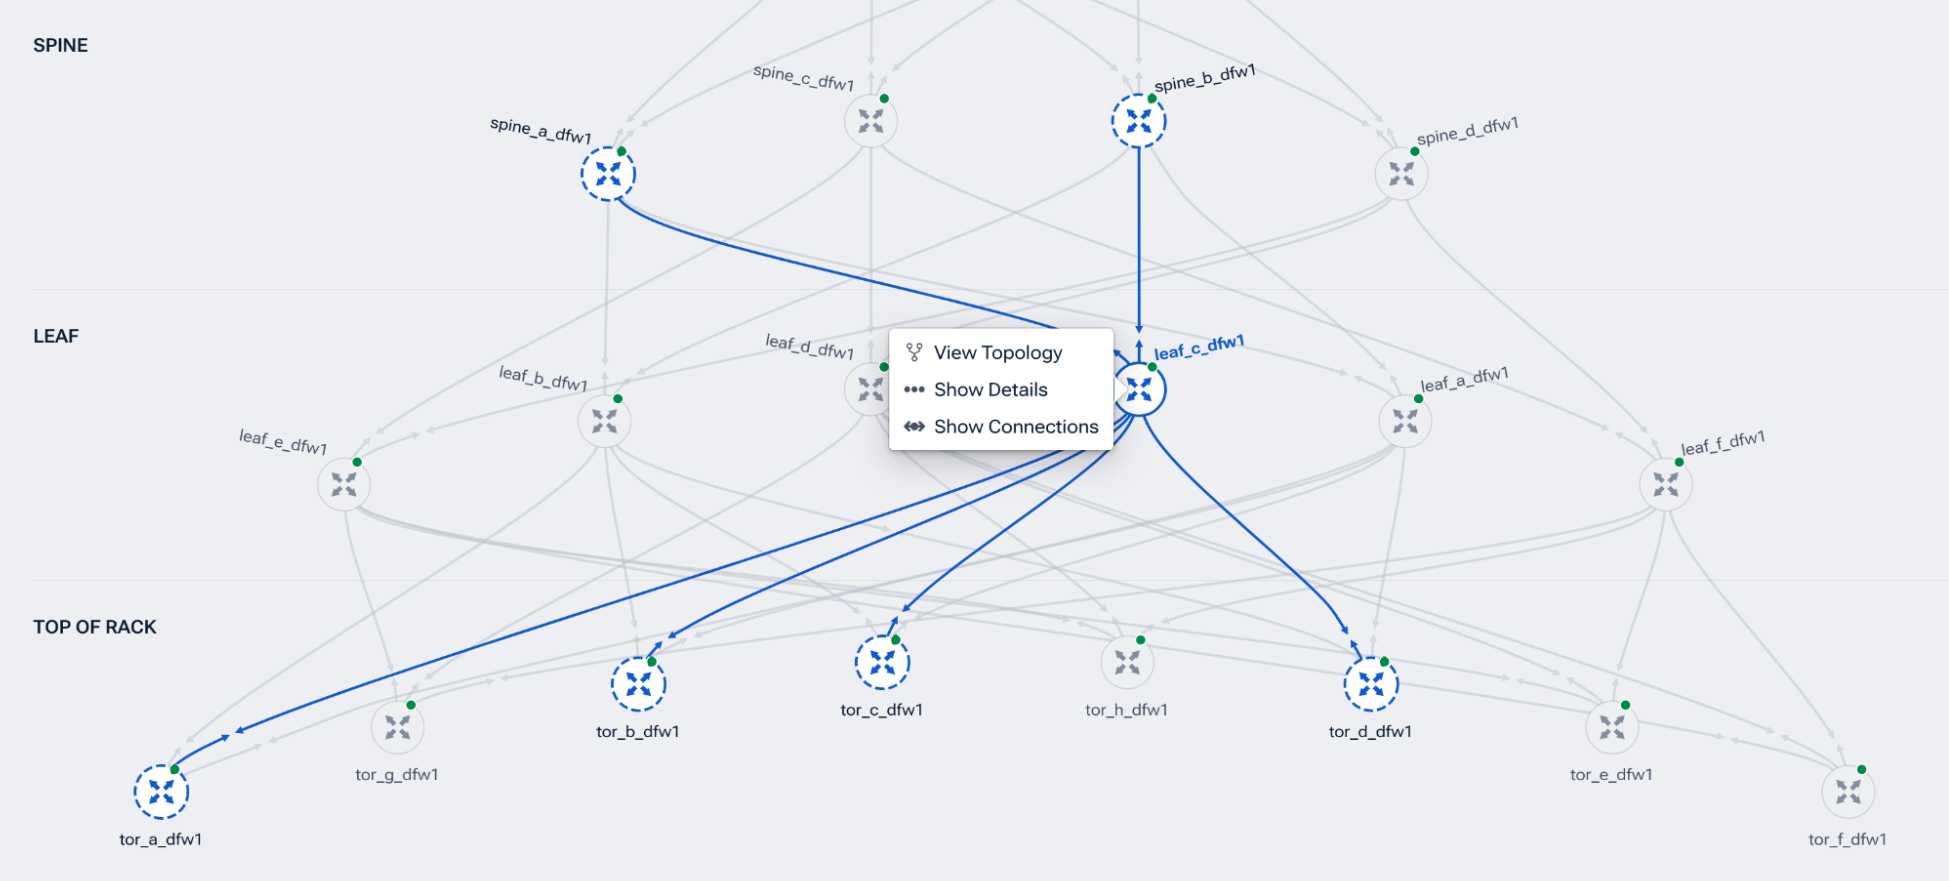
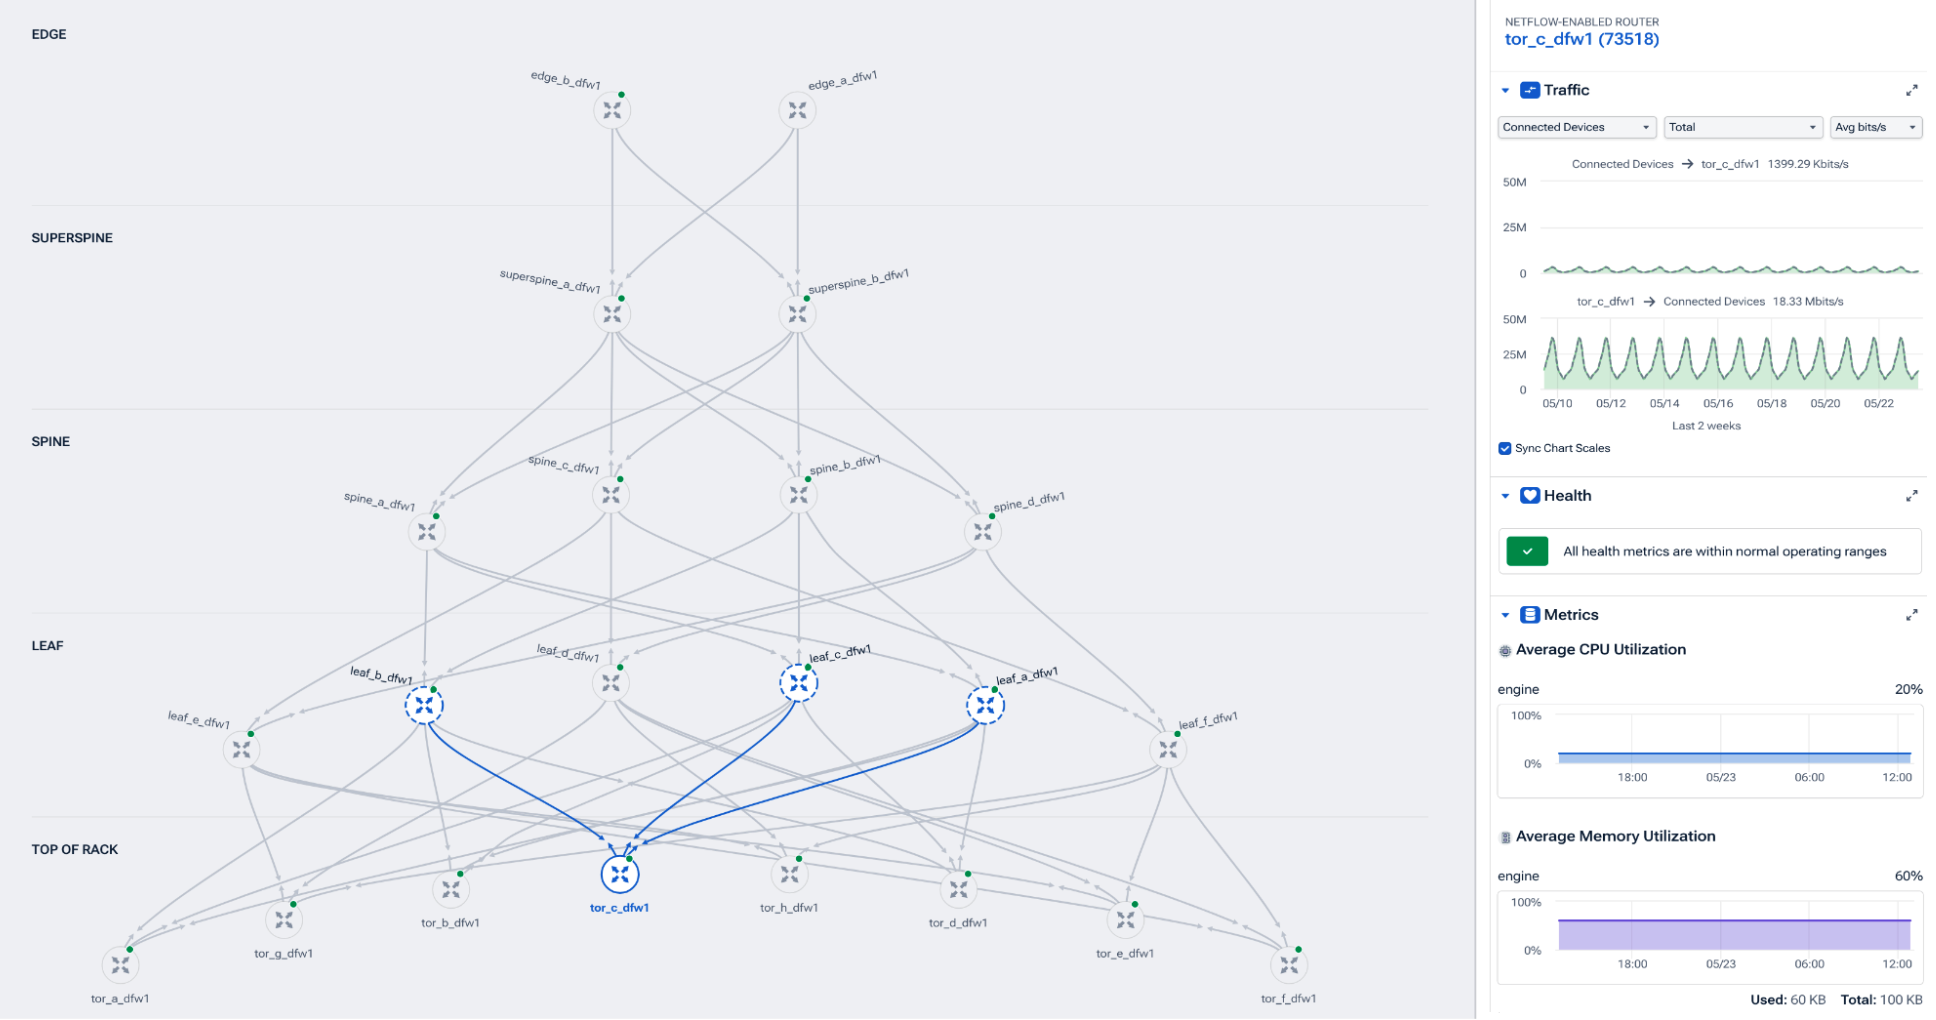
This topology context matters because it allows any query to focus on “traffic that traverses the spine tier” without needing to guess interface names. We can also use this to drill into specific device metrics to get a quick glance of average interface utilization, CPU and memory usage, and so on.
A typical leaf-spine data center may use an oversubscription ratio of 3:1, 4:1, or even 5:1, which means there is variation link-by-link that also changes over time. If flows are pinned incorrectly or if the oversubscription ratio is too high, links sit idle, wasting resources in terms of cost-per-port, as well as incorrectly sized switching hardware, among other issues.
In this next image, notice that we can see what a leaf switch is connected to, which then forms the basis of our more in-depth queries in Kentik’s Data Explorer.
Identifying load imbalances
Data Explorer enables us to identify capacity on our links and filter for specific devices, timeframes, or traffic types as needed. In the image below, we have the result of a relatively straightforward query of our San Jose data center. We’ve filtered by device, site, source, and destination interface name, as well as average traffic, capacity, and other relevant factors. At even a quick glance, we can see which interfaces in this timeframe are averaging the most traffic and which are not seeing much at all.
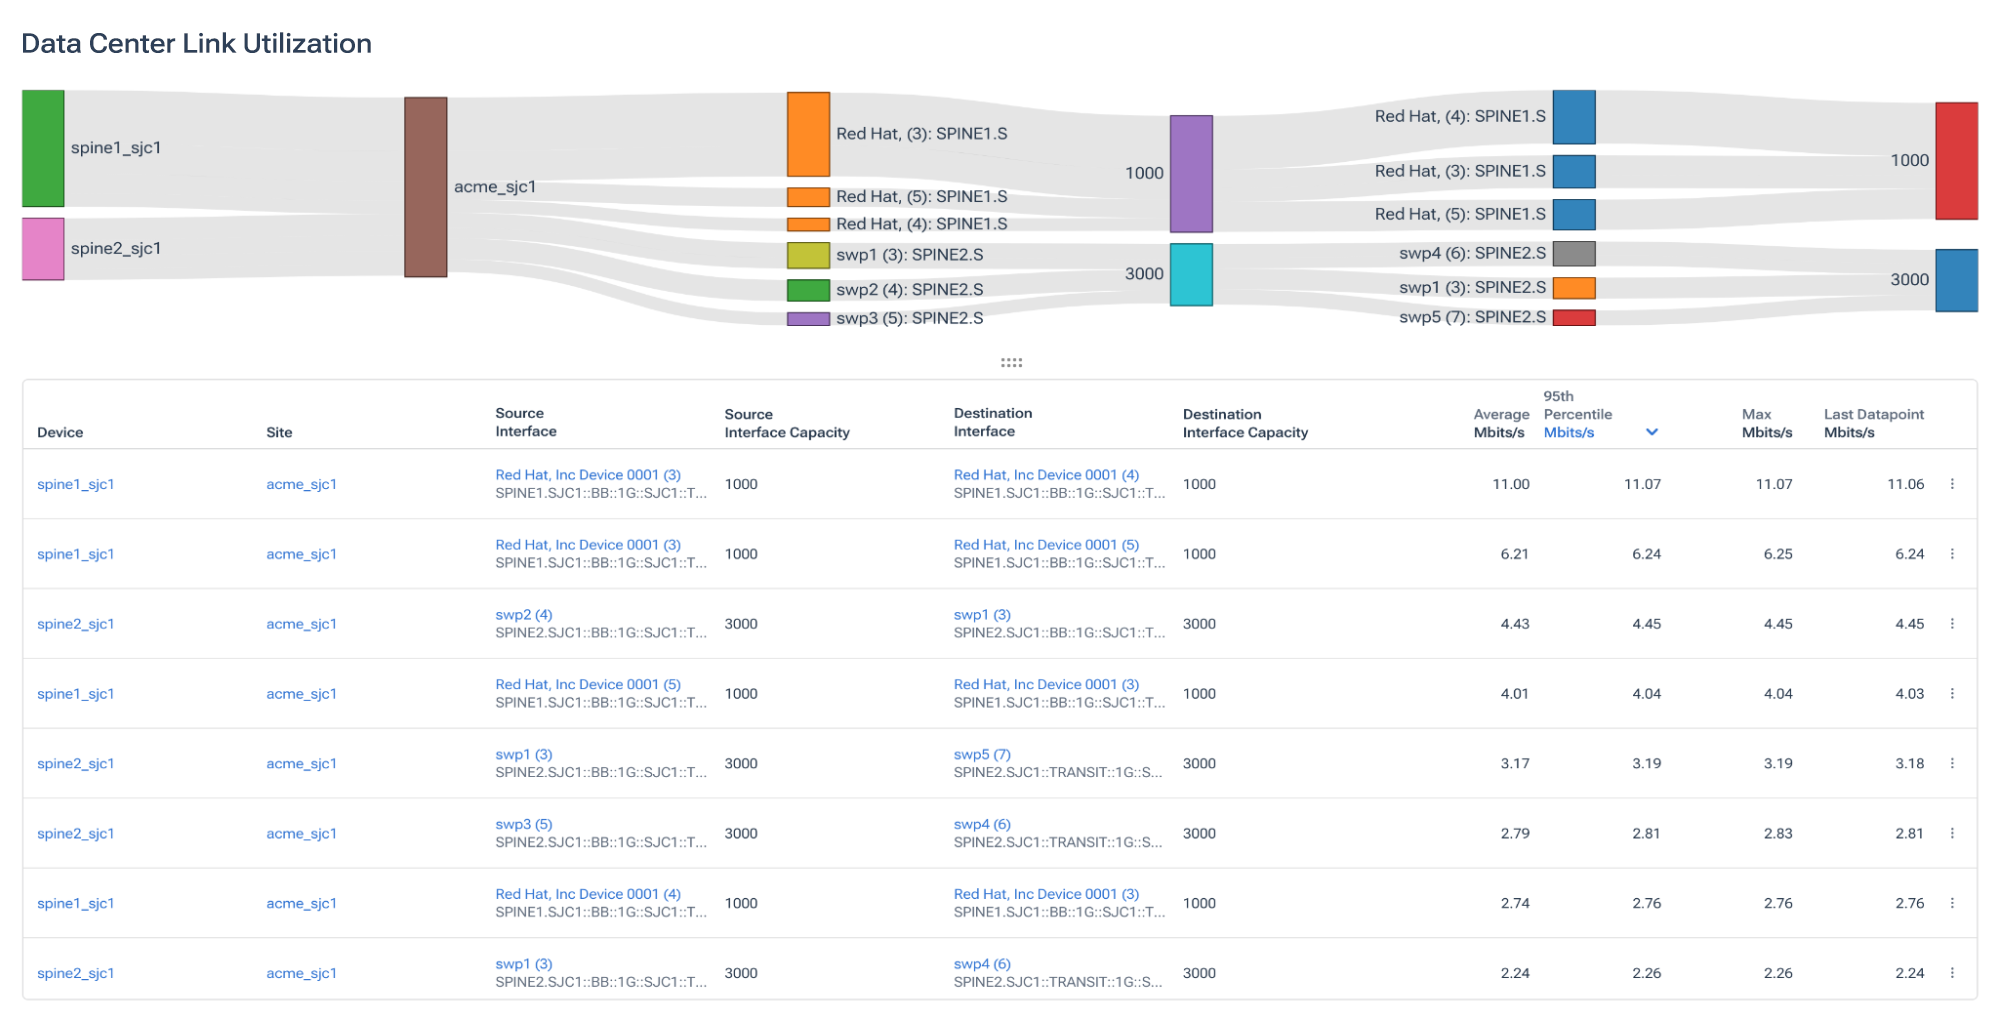
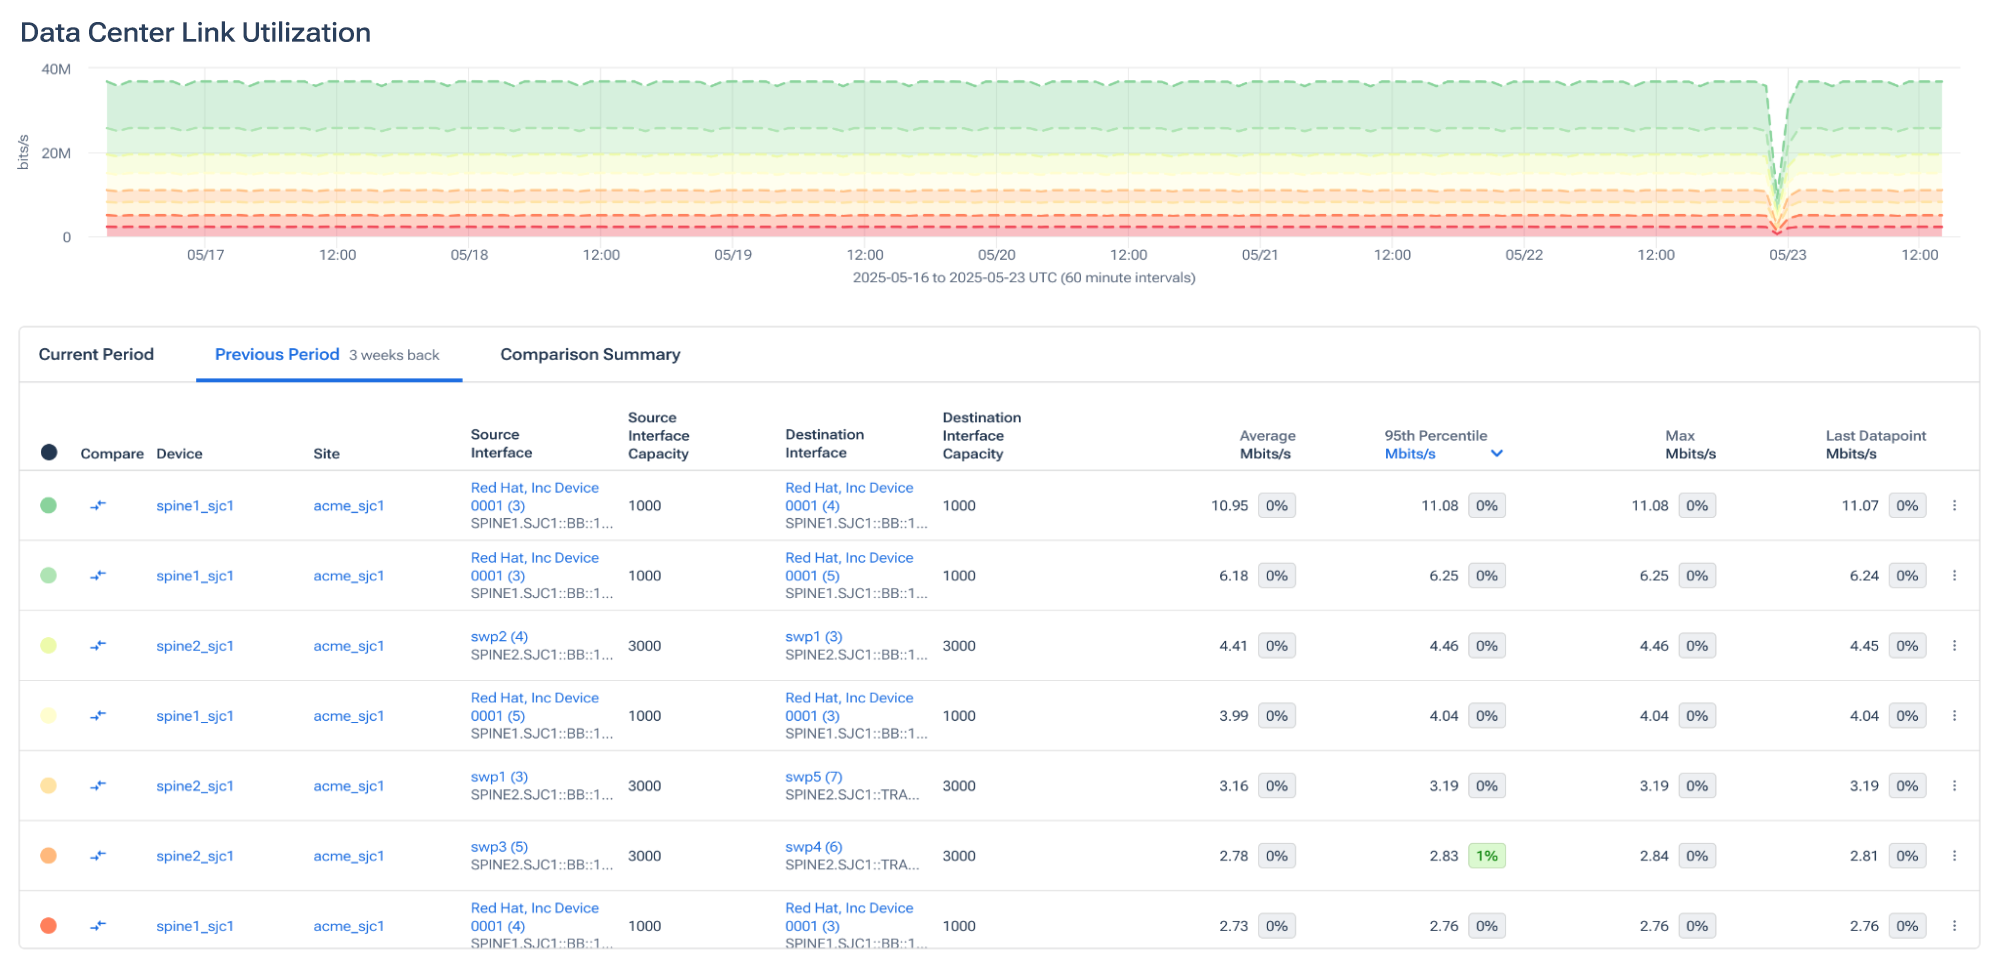
A single snapshot doesn’t tell us whether the imbalance is transient. Kentik stores telemetry so that we can compare traffic over previous time periods. That way, engineers can discover that the same small set of ECMP paths has been hogging traffic for weeks, a classic elephant flow pinning or a hashing bias toward specific spine IDs.
In the following screenshot, notice that we are examining the same query, but over the previous three weeks.
Lastly, we can provide a comparison summary, which is presented below in the following image.
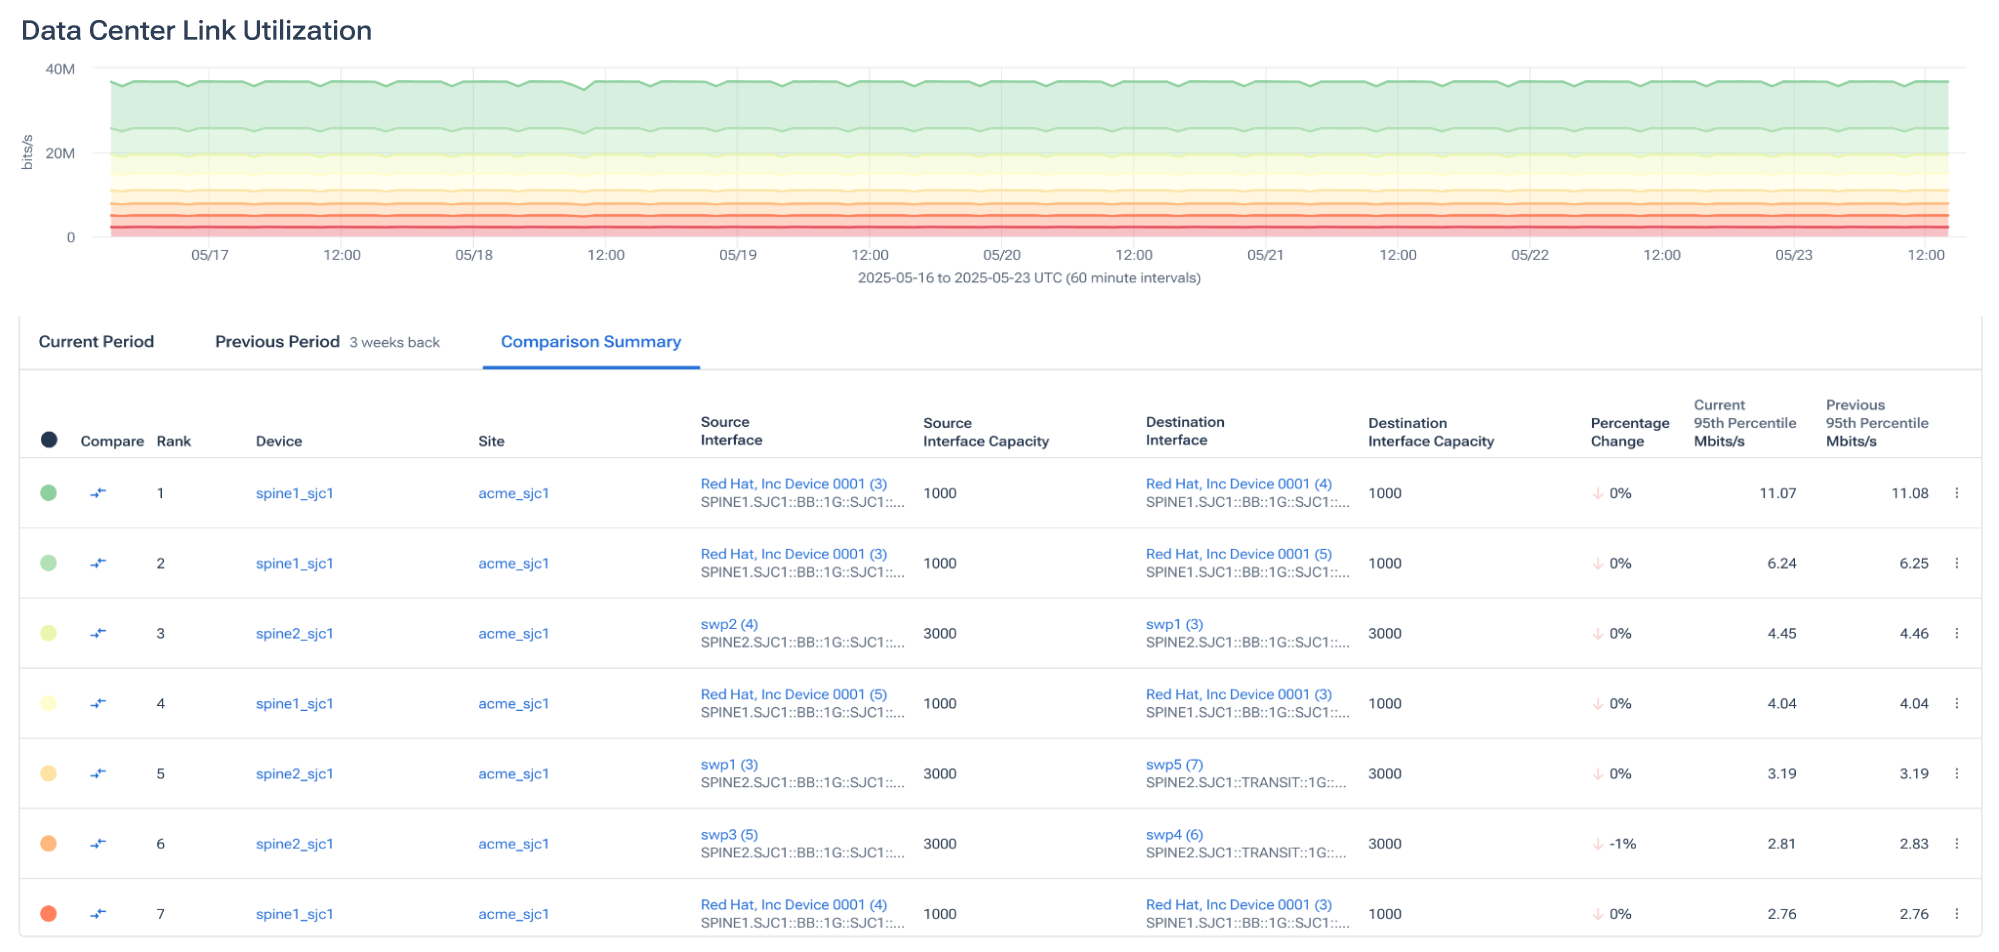
In our example, we observe that there is very little to no deviation in the traffic volume on our links over the last three weeks, resulting in some links that do most of the work and others that sit almost completely idle.
Alerting on idle links
Idle links remain hidden until someone actively searches for them. If there isn’t a noticeable performance degradation or failure, underutilized links will often go unnoticed. Kentik’s Alerting function lets teams convert the queries created in the Kentik Map and in Data Explorer into relevant and meaningful alerts. For example, a simple way to start could be creating an alert that fires when any spine uplink in a specified group stays under 1% utilization compared to its capacity.
Alerts can certainly get more complex by using baselines, multiple triggers and filtering options, and so on, but regardless of how complex or straightforward the alert is, the core benefit is that engineers know when links are sitting idle automatically, without having to search for them and without having to wait until there’s a problem.
From insight to action
So, Kentik doesn’t just detect idle paths; it turns that insight into a workflow. With Kentik network intelligence, engineers can:
- Discover imbalances with automated policies.
- Diagnose root causes via the Kentik Map and Data Explorer.
- Validate fixes with synthetic traffic and real-time flow feedback.
Whether the fix involves a hashing tweak, a routing policy change, or redrawing VLAN boundaries, Kentik shortens the journey from “we suspect waste” to “we prove and eliminate waste.”
A leaf-spine fabric’s beauty is its built-in path diversity, but its curse is the ease with which subtle hashing quirks can undermine that diversity. Kentik shines by making per-path utilization visible, searchable, and meaningful. With flow records, topology enrichment, and AI-assisted analysis in one place, network operators reclaim idle bandwidth, delay expensive upgrades, and deliver the balanced throughput the fabric was built to provide without guesswork or packet captures.
