Introducing Cause Analysis: Instant Triage for Traffic Changes with Kentik AI

Summary
Introducing Cause Analysis from Kentik, designed to simplify network traffic analysis and rapidly identify the root cause of issues. Learn how this exciting new feature streamlines troubleshooting, makes complex insights accessible, and boosts team efficiency for all users.
If you know Kentik, you know we got our start in network traffic analysis. Traffic data helps identify, triage, troubleshoot, and solve network questions and problems. From our work with some of the world’s largest networks, we know that when performance degradation and cost spikes arise, traffic insight is often the most powerful source of network intelligence. But understanding traffic patterns can be tricky. Not only is traffic data enormous in volume, but it can also require intuition, years of experience, and a bit of luck to know where and what to look for. Even for experienced users, finding relevant insights involves trial and error.
Enter Kentik AI. To make the process of analyzing and interpreting network traffic data easier for new users and faster for experienced users, we’ve launched a new Kentik AI capability called Cause Analysis. Cause Analysis enables users to quickly identify the most likely drivers of traffic for a specified period of time in just a few clicks. Want to quickly know where the bulk of traffic is coming from or going? Need to help debug a talkative app? Want to know what the traffic is taking up the most bandwidth over a link? These are just some of the scenarios that Cause Analysis can now help with.
What accelerating work looks like
To show how Cause Analysis works, let’s take a look at what happens when you need to investigate traffic – in this case, an unknown spike that triggered an alert you want to investigate.
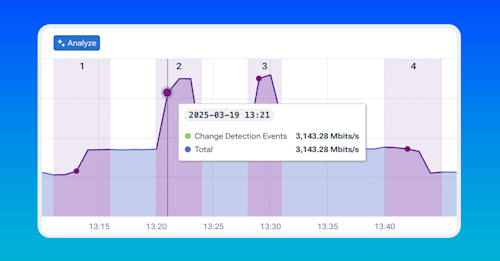
In the past, using Kentik, you’d jump into Data Explorer to investigate. First, you pull up the relevant time frame and quickly spot the spike that triggered the alert:
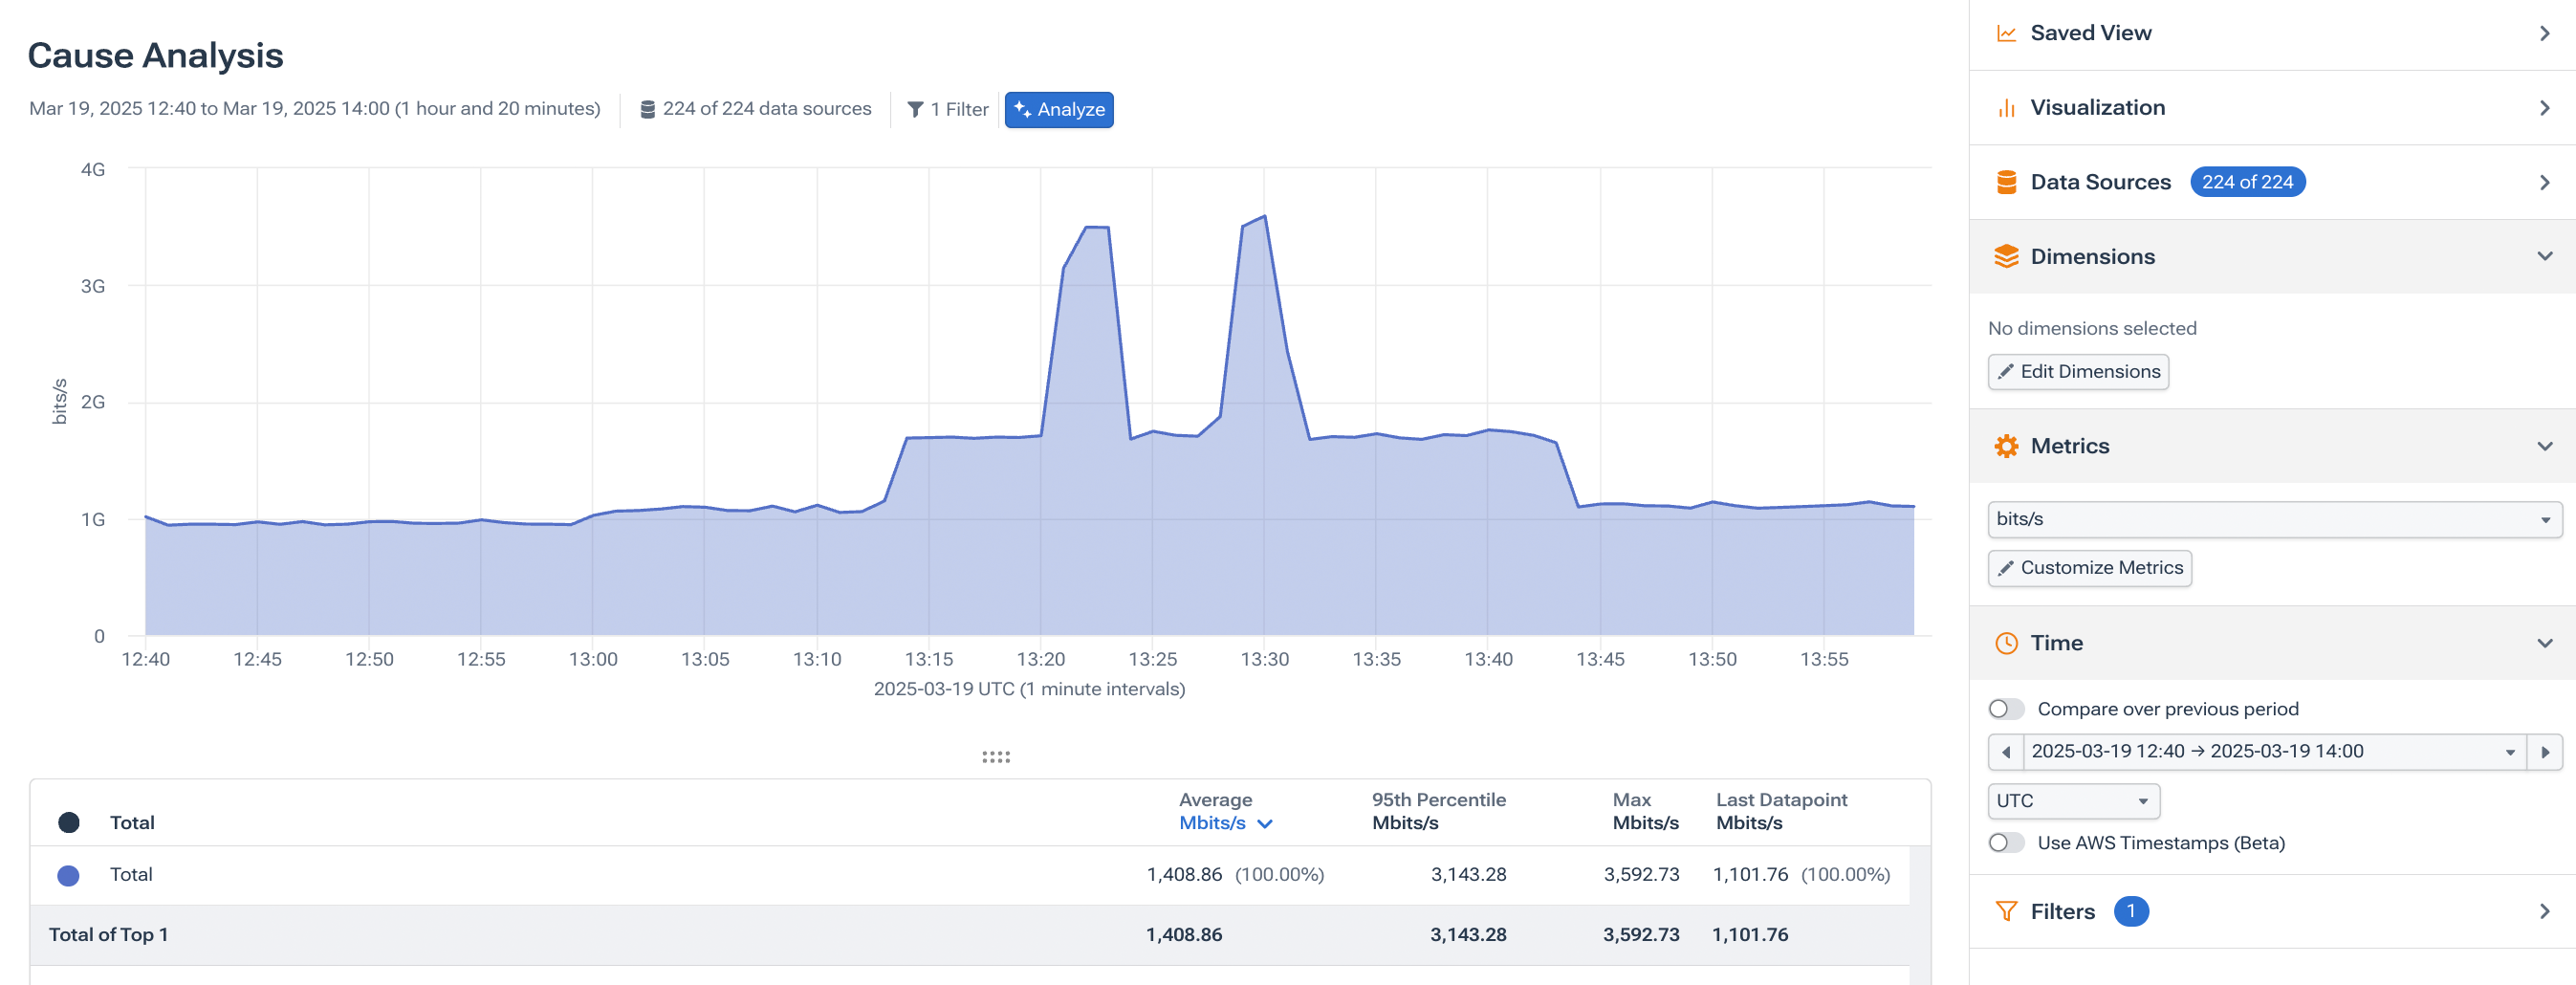
But while you can see the spike, you still don’t know what’s causing it. So you start digging deeper. You think it might be relevant to isolate the traffic by device, so you add devices as a dimension to the data.
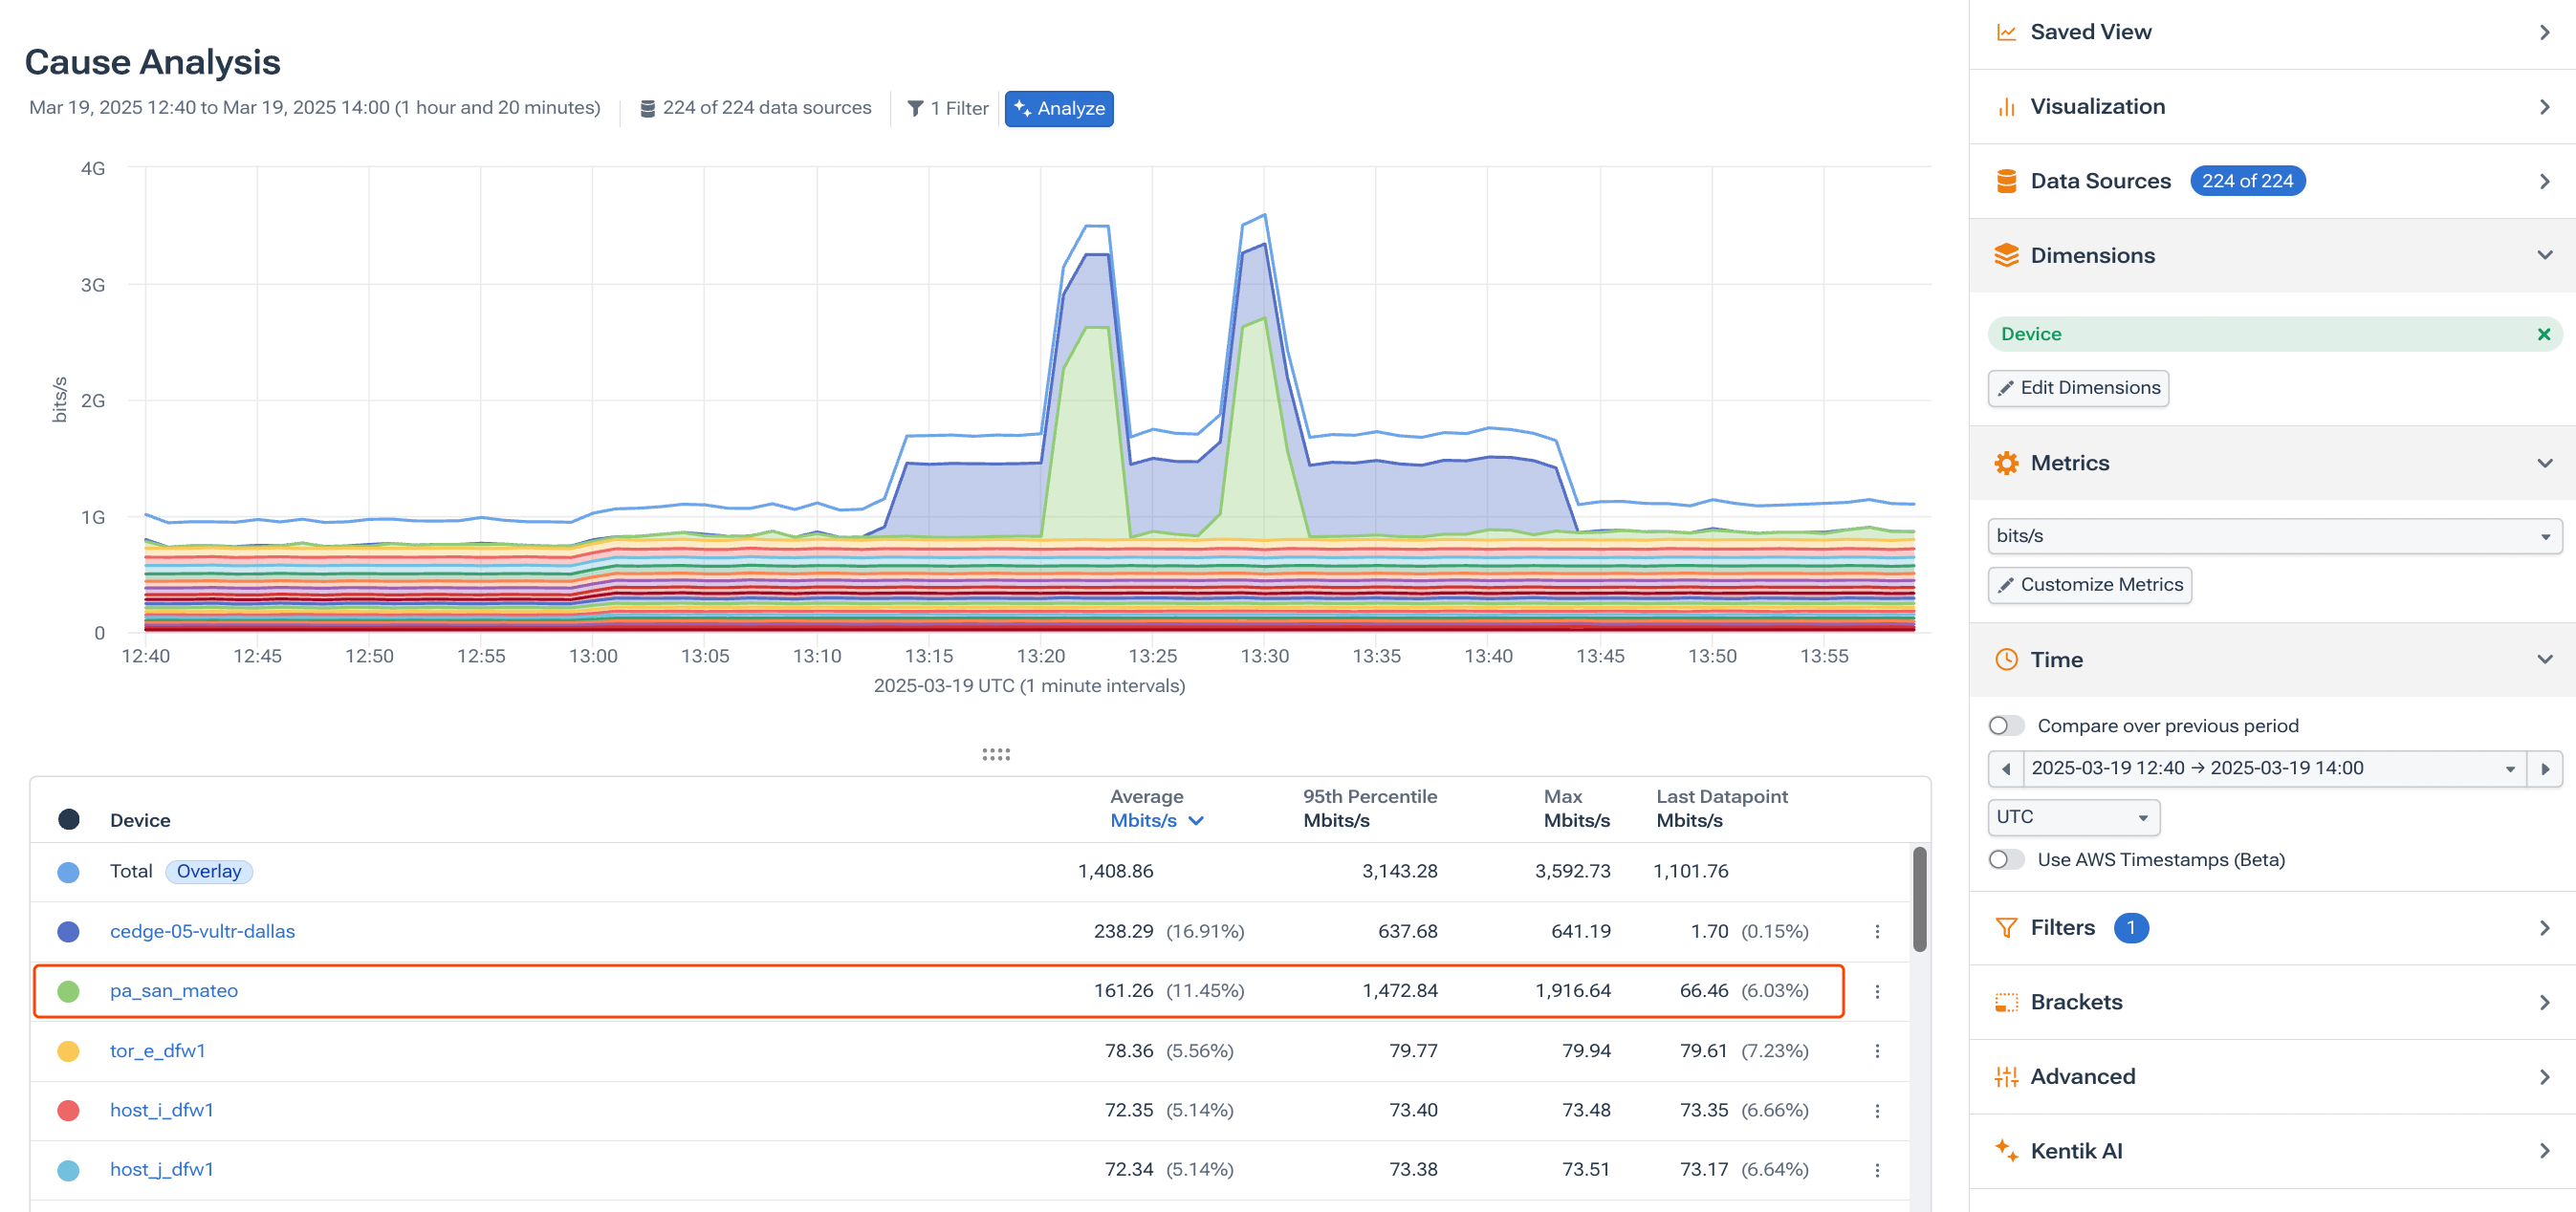
Your intuition pays off, and you notice that most of the spike in traffic is almost all tied to one specific device – pa_san_mateo. This is helpful, but not conclusive. You want to investigate further, so you create a new filter to include only traffic for the device and run a new query.
You keep adding dimensions — recursively looking to see if that accounts for or narrows down your investigation. You look at things like
- source/destination interfaces
- source/destination ASN
- source/destination IP
- application traffic
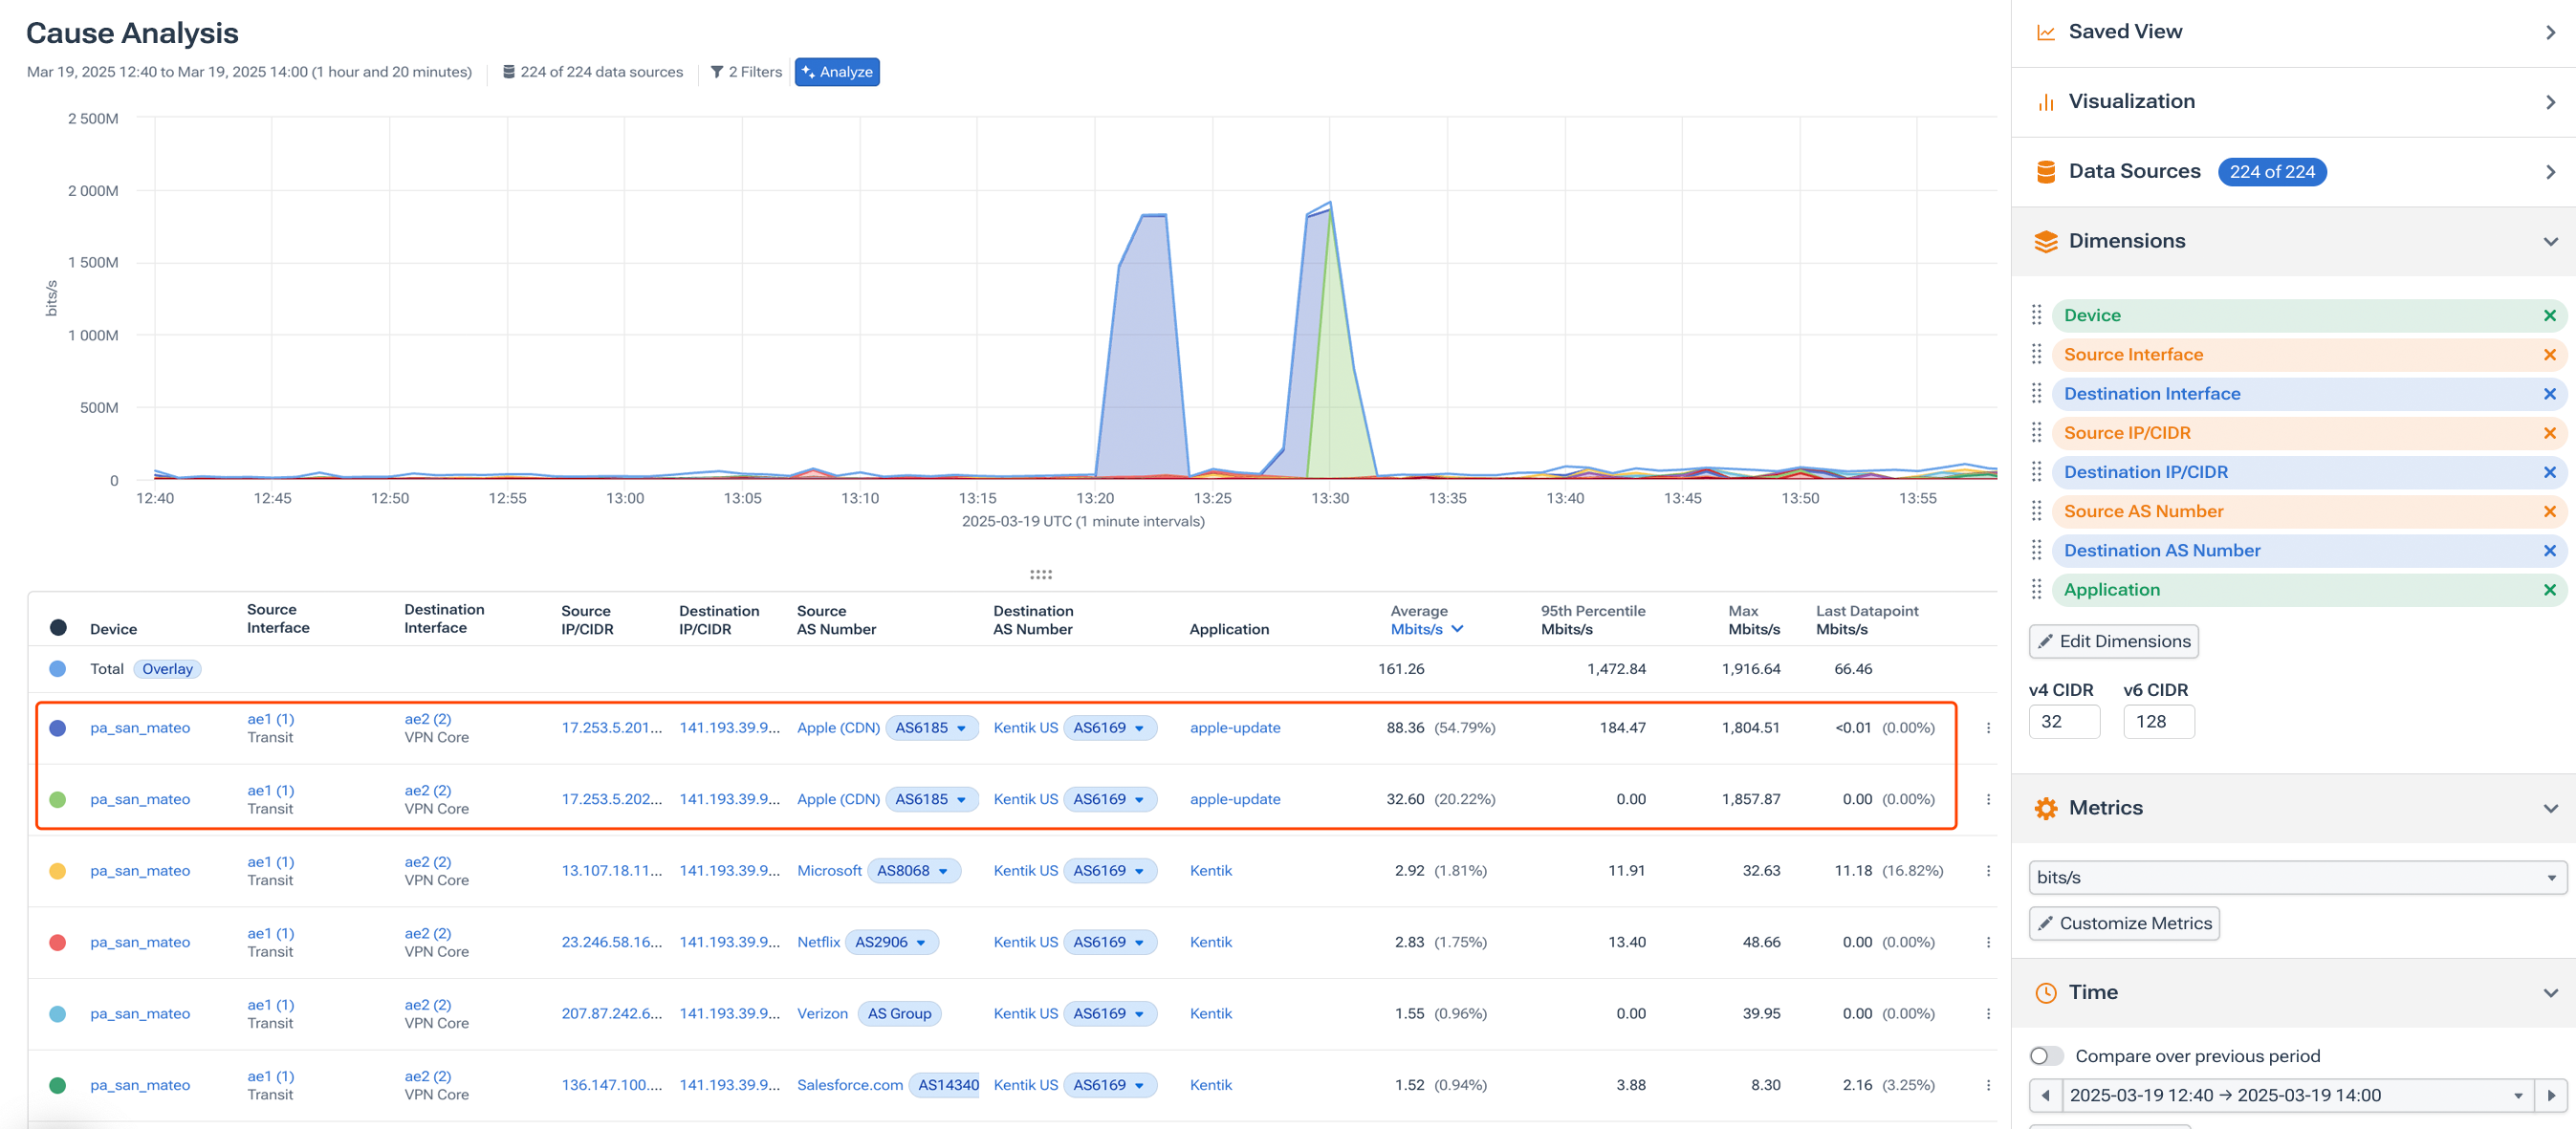
Finally, after several queries, you think you’ve found the answer: An Apple update was the main contributor of the spike, with data into it originating from the Apple CDN between IP addresses 17.253.5.201/32 to 141.193.39.97/32.
This is the traditional workflow. It’s powerful — and with the proper knowledge, you can get exactly what you need. But it also depends on human intuition, familiarity with the tooling, and available time. And if you’re under pressure — on an outage bridge, trying to respond to execs, or just juggling ten other things — that manual cycle slows you down.
Now let’s look at how Cause Analysis makes this way faster.
We start back where we were – with a graph showing us a few traffic spikes that we want to investigate. Only this time, we’re going to click on Cause Analysis and let the AI do the heavy lifting. And… that’s it.
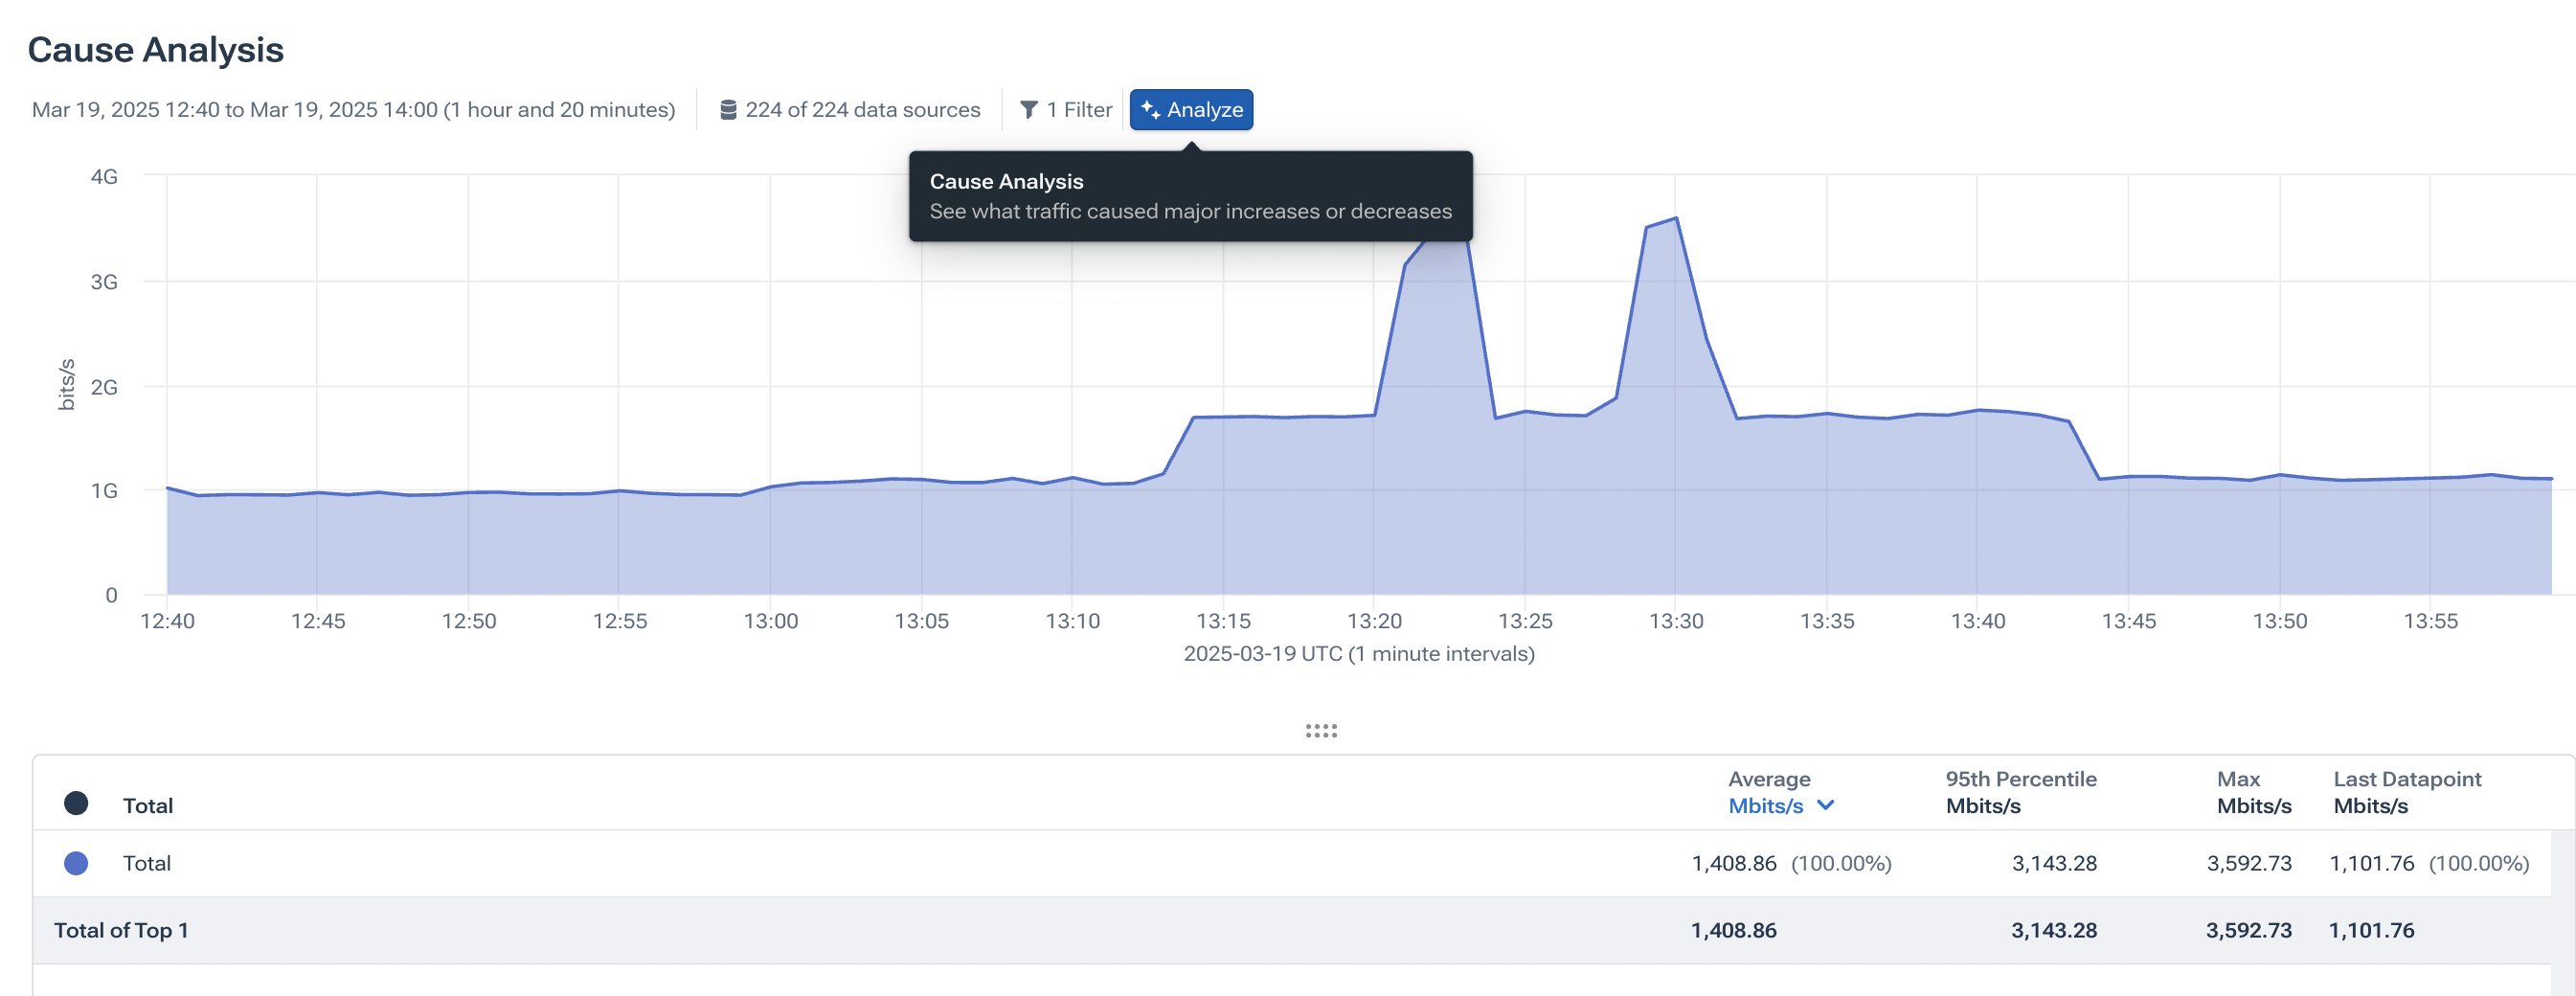
In just a few seconds, Kentik AI kicks off time series change detection, which identifies spikes and drops in traffic, performs a comparison of those two windows to find the largest contributors to these changes, and summarizes the findings – all in one click.
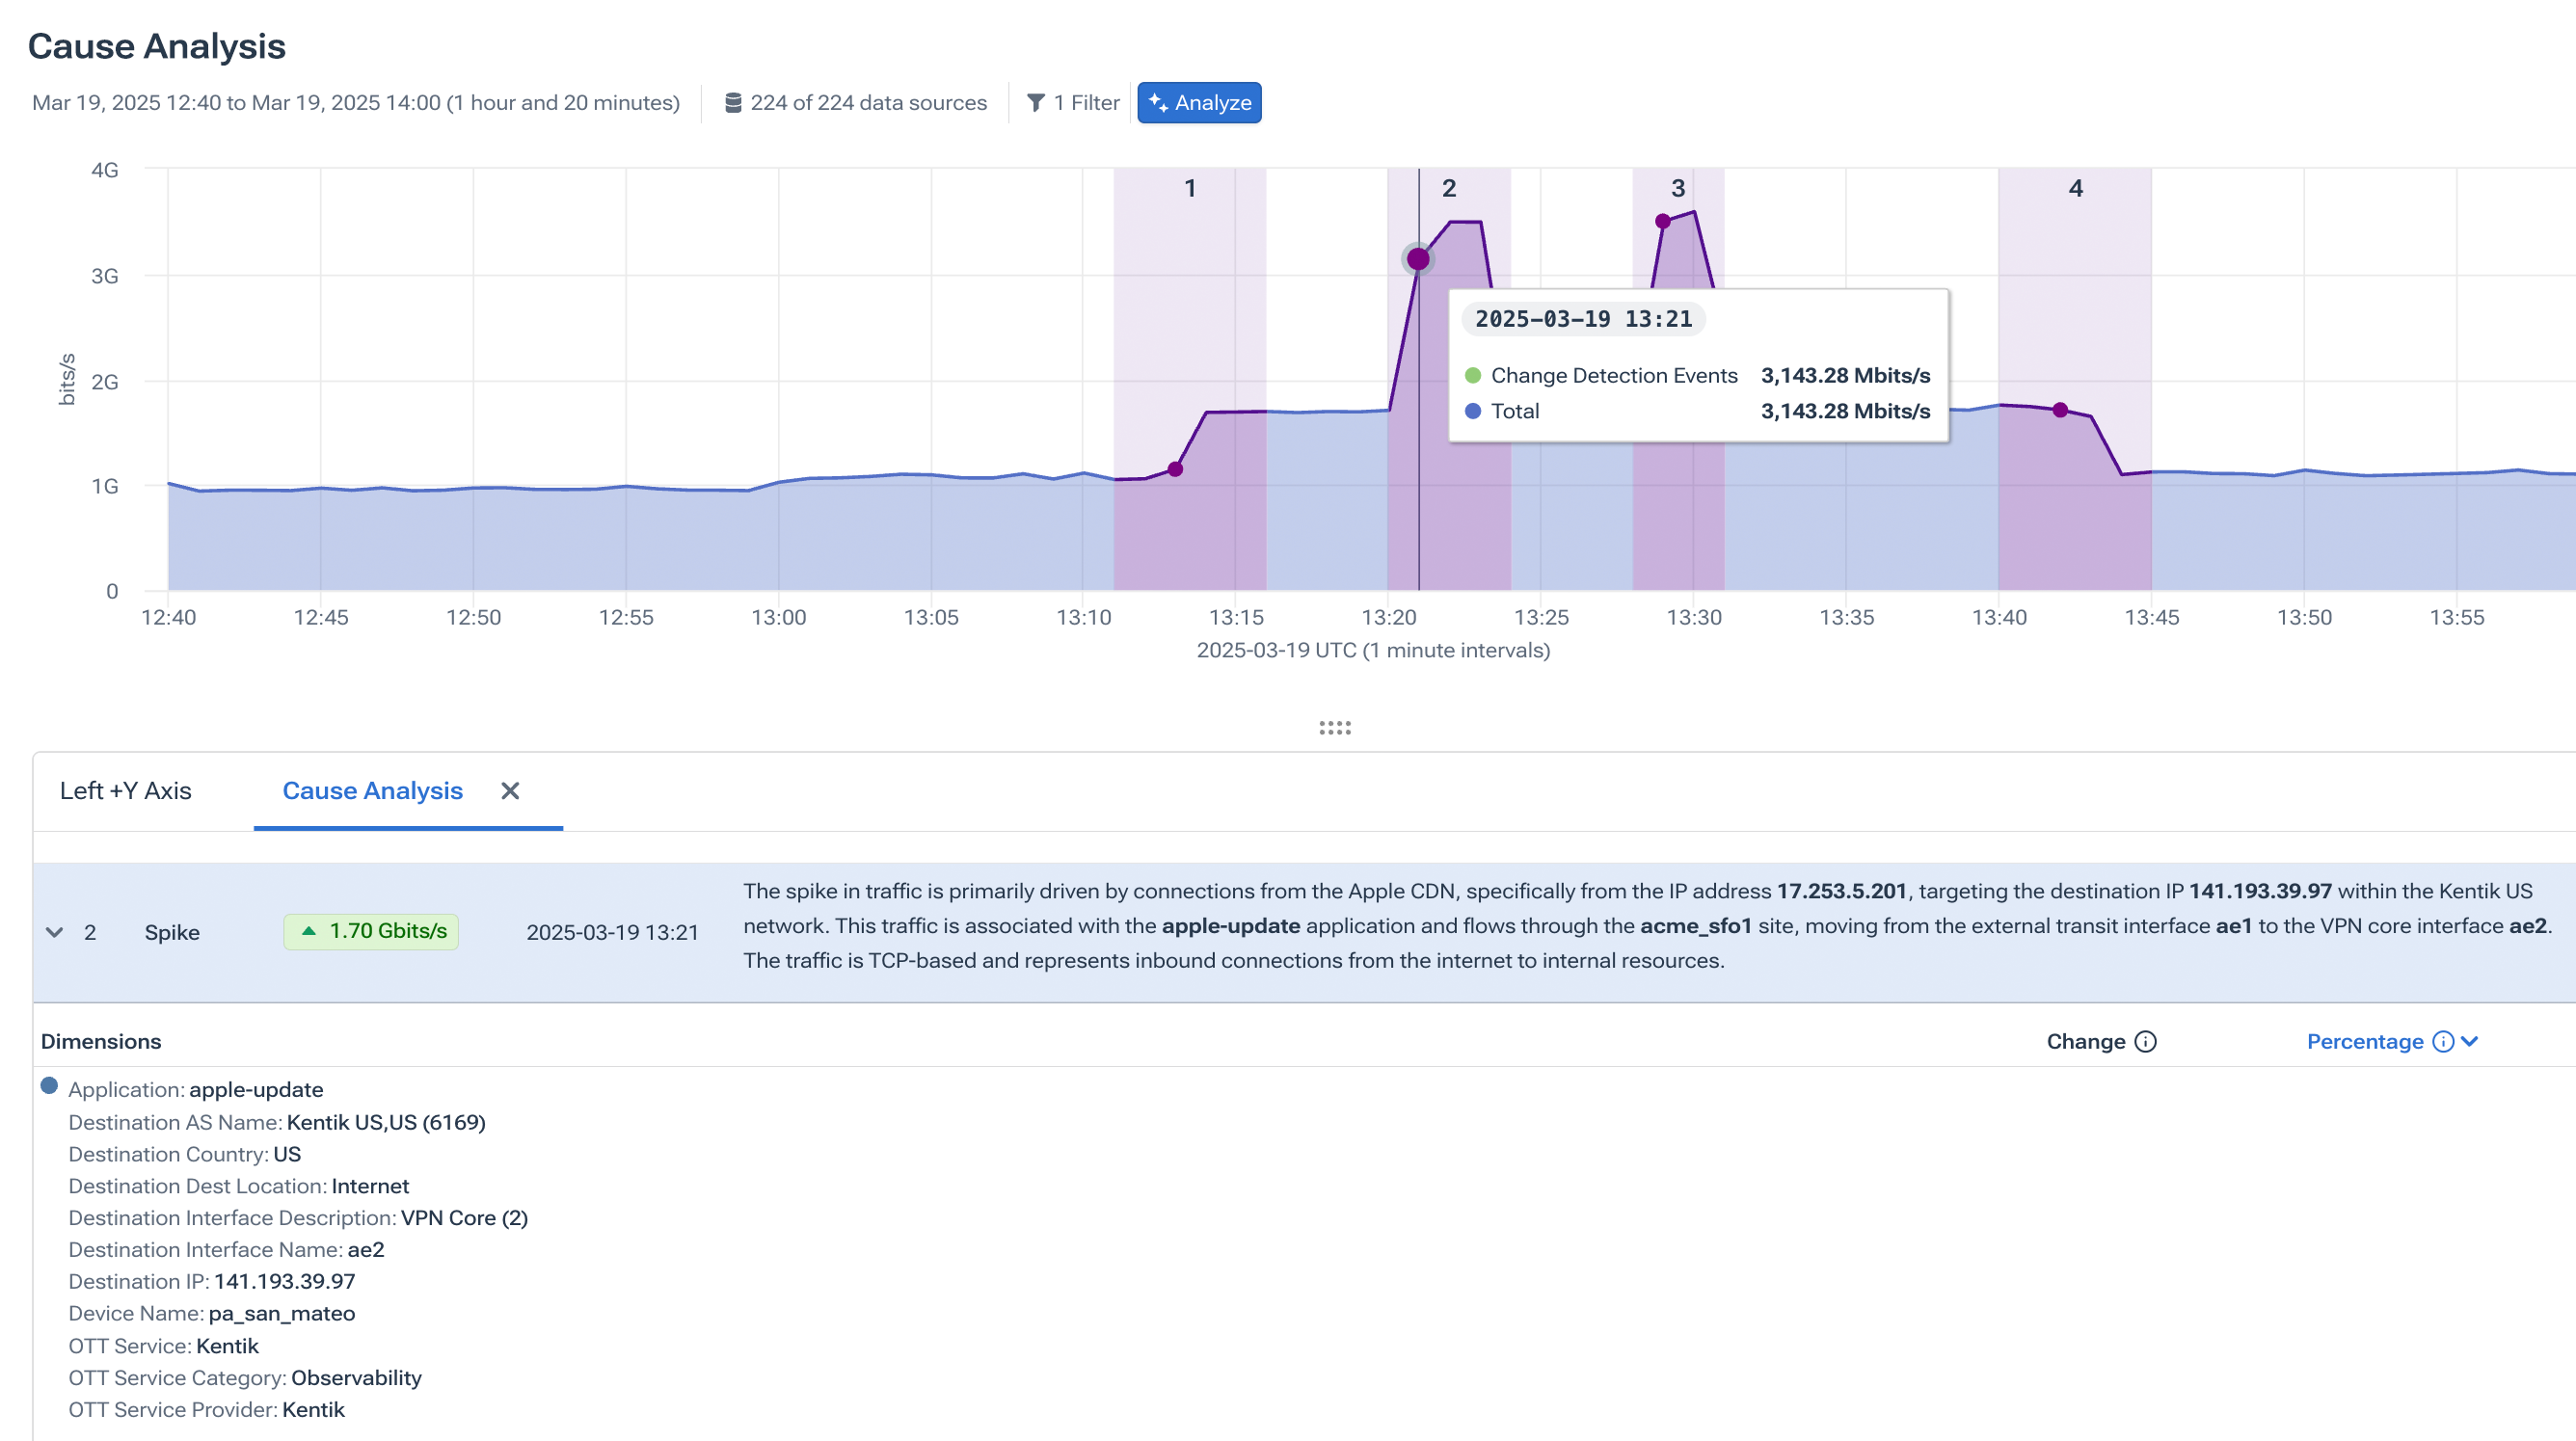
Here, we can immediately see the culprit: a 1.70 Gbit/s traffic spike of apple_update traffic from the Apple CDN, destined for Kentik, routed through specific interfaces (ae1, ae2) and originating from IP 17.253.5.201 and heading to 141.193.39.97. Cause Analysis gives us the full picture — summarized in plain language, with all contributing dimensions broken out and ranked.
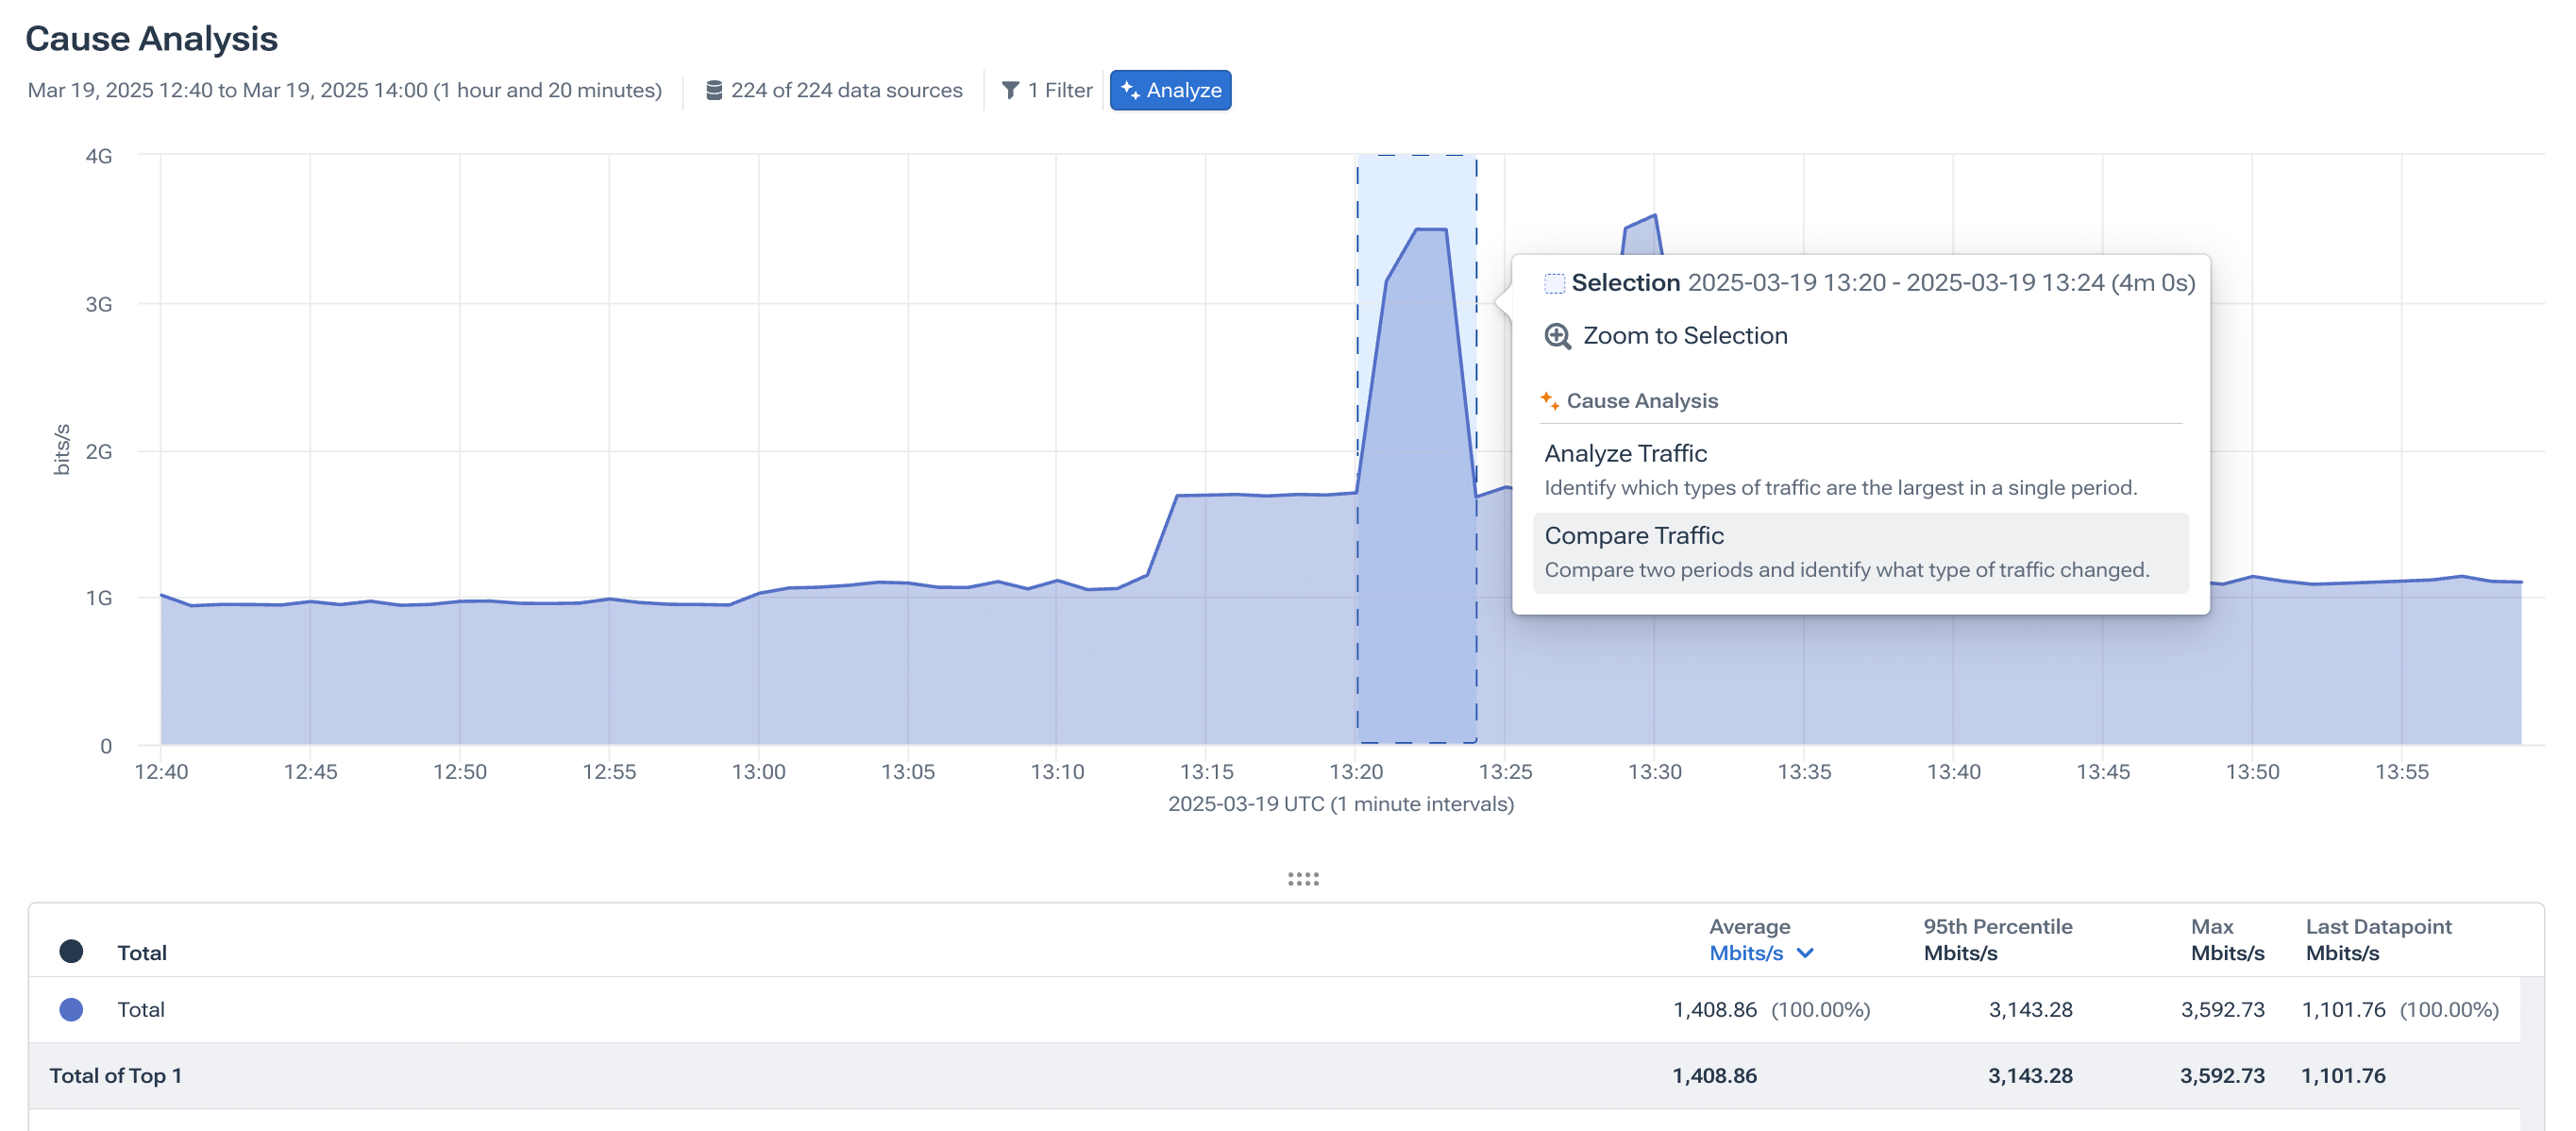
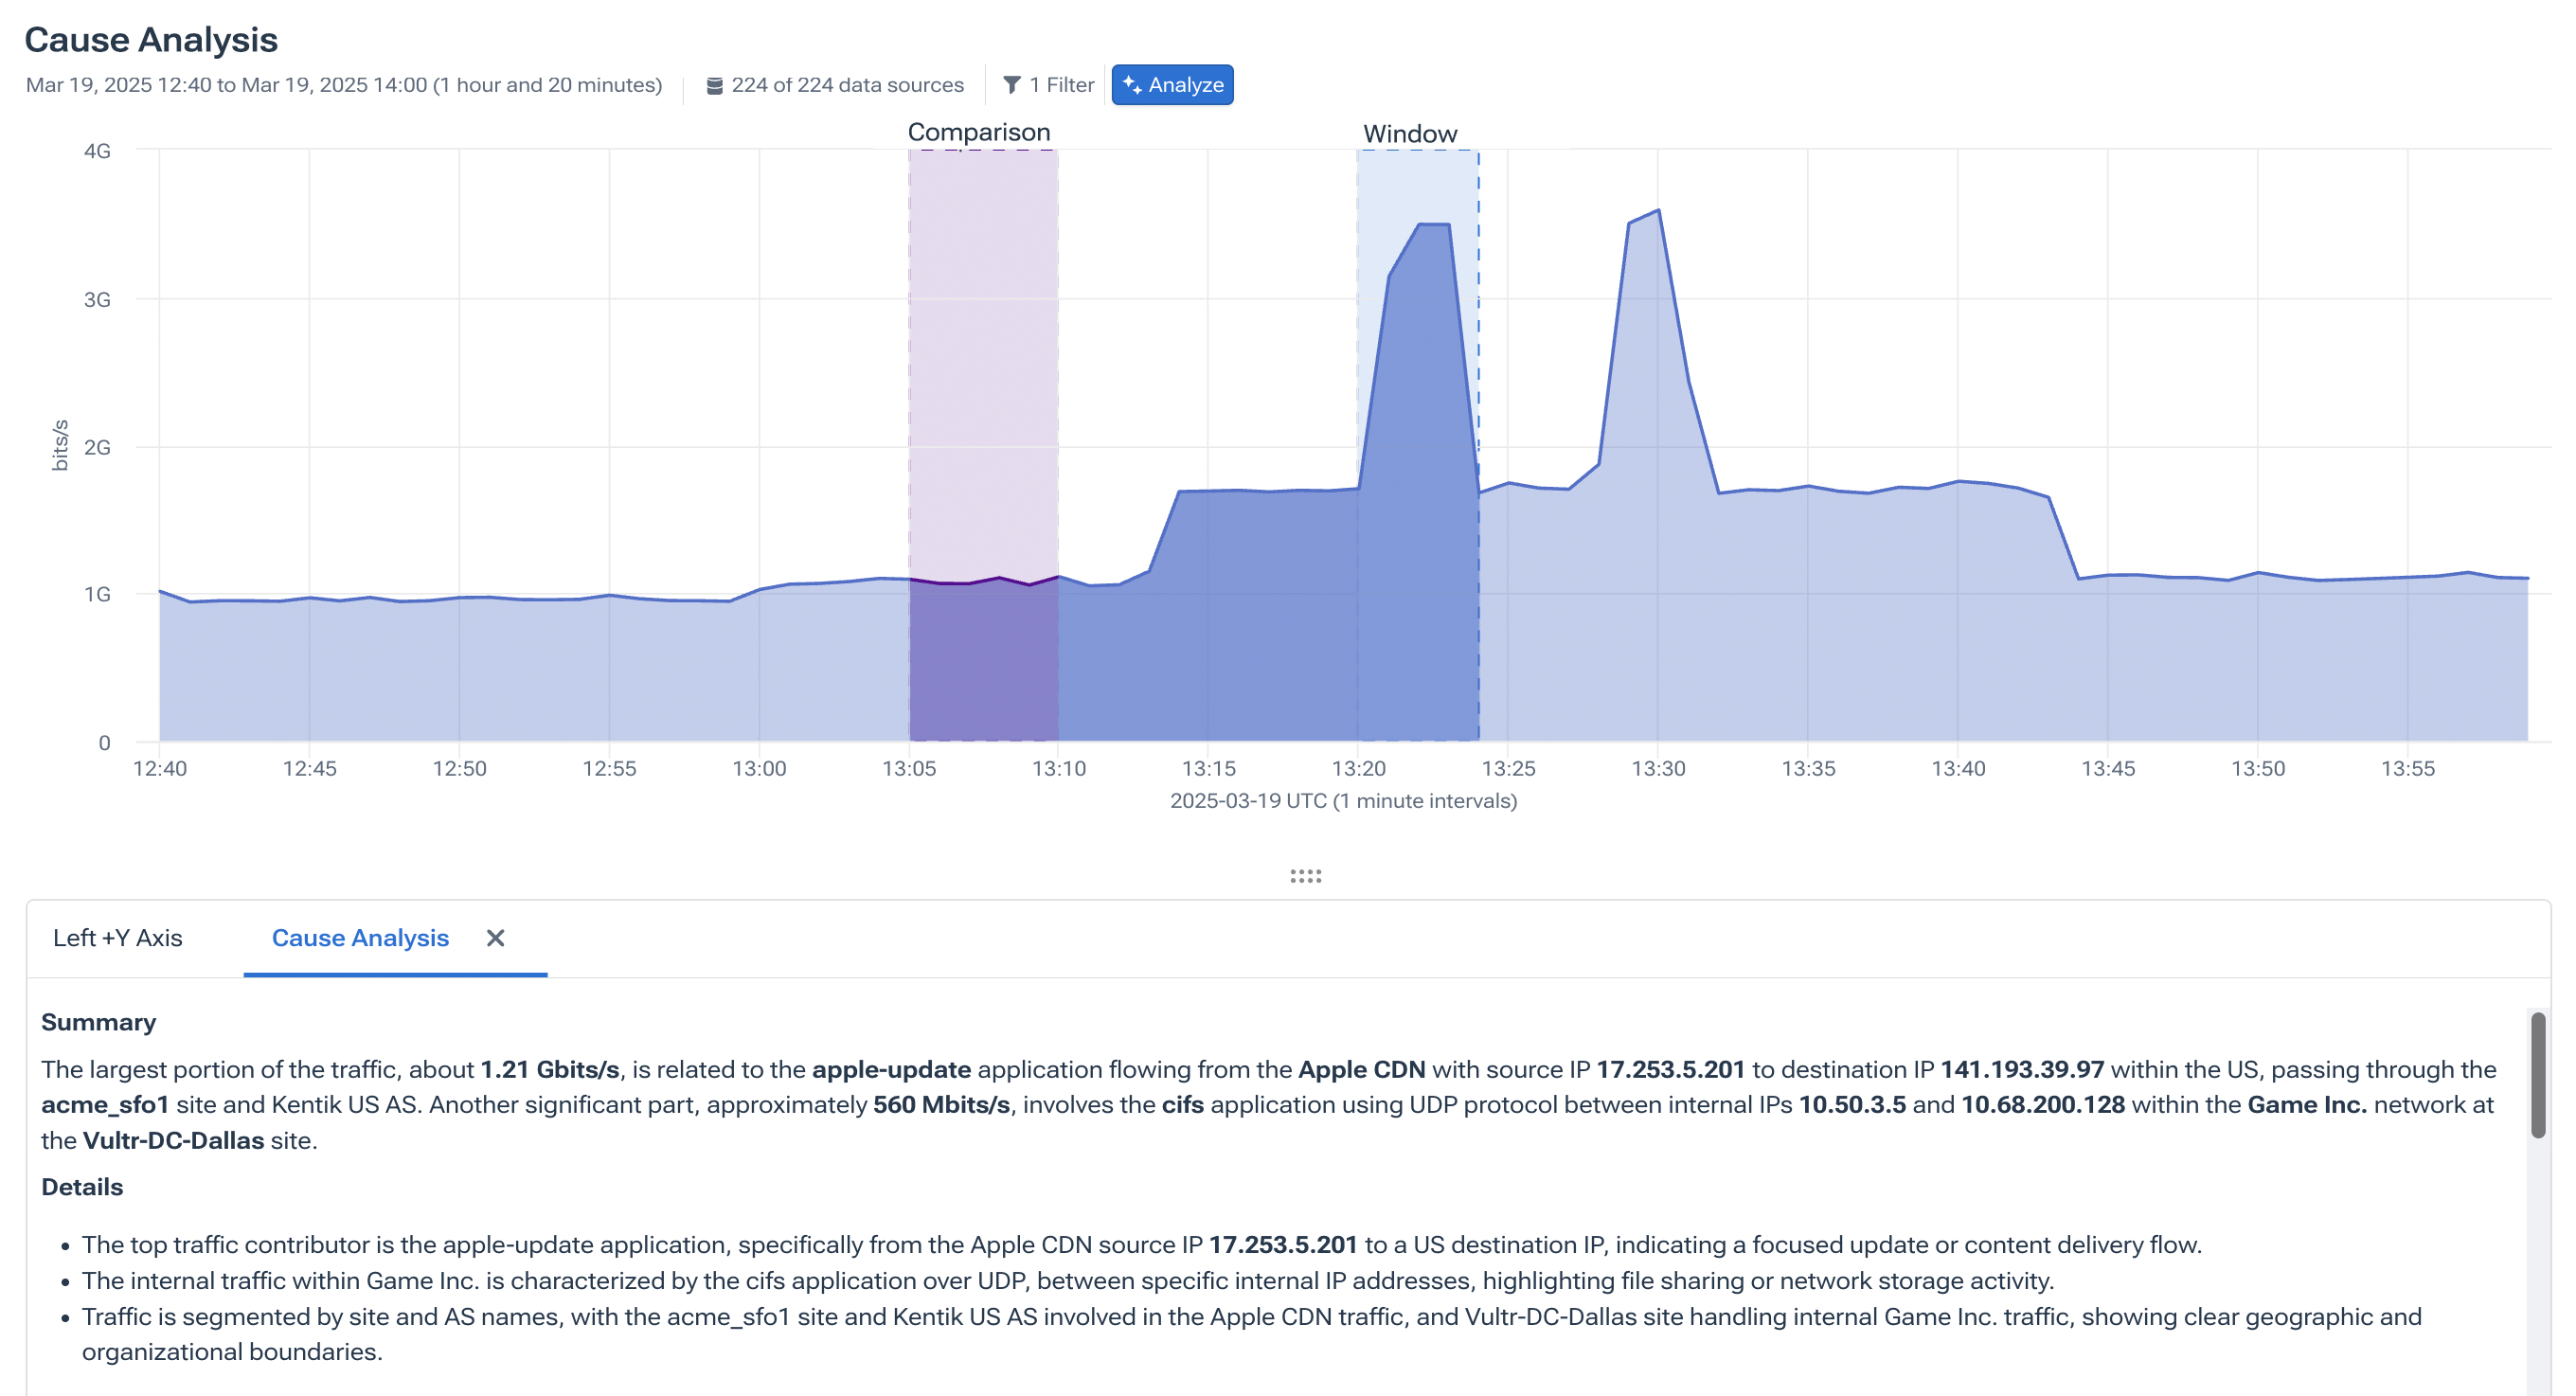
Cause Analysis can also compare two manually selected traffic periods to find the difference in traffic between them. In the scenario above, this could have easily been the route we took instead, and we would still have found pretty much the same result. In this case the bitrates are slightly different because of the variance in manually selecting the comparison windows, but the dimensions are all the same.
When every second counts
Whether you’re managing a complex hybrid infrastructure, defending against performance regressions, or simply trying to keep SLAs intact, Cause Analysis gives you the clarity to act quickly and confidently.
When troubleshooting under pressure, every second counts. Cause Analysis enables teams to move faster — not just by speeding up queries, but by skipping entire steps in the troubleshooting process. It automates the kind of investigative analysis network teams do every day — isolating what’s going on across your network and what might have changed quickly so you can get on with understanding what to do about it sooner. That, in turn, translates to the KPIs that matter: faster mean time to resolution (MTTR) and improved team efficiency.
It also democratizes access to insights. Less experienced engineers don’t need to know every pivot or dimension to run a proper investigation, while senior engineers can get to a resolution faster, without slogging through routine steps. The whole team benefits from having consistent, reliable answers they can trust.
It’s one more way Kentik turns network telemetry into network intelligence.


