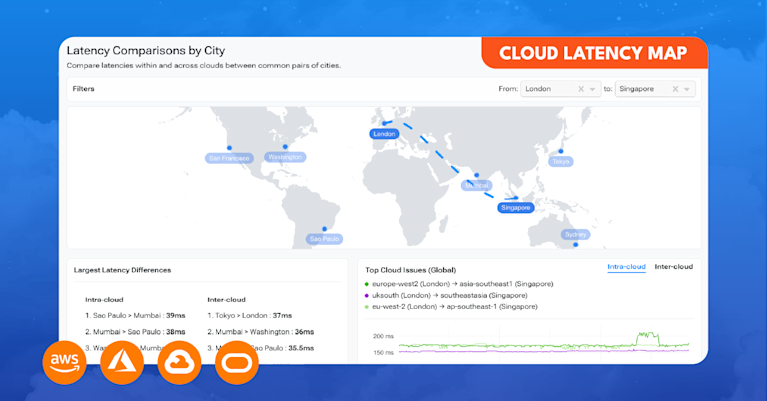
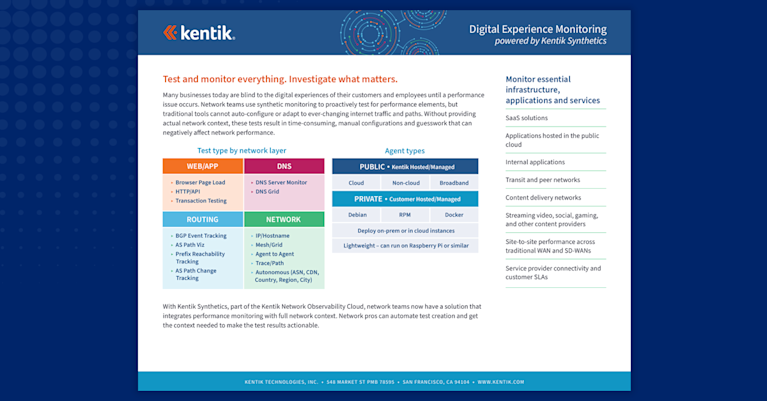
Deliver Exceptional Digital Experiences
Proactively test and monitor networks, clouds, web pages, and applications.

Identify if it’s an infrastructure or third-party app issue.
Understand global and local performance.
Test and monitor everything that matters.
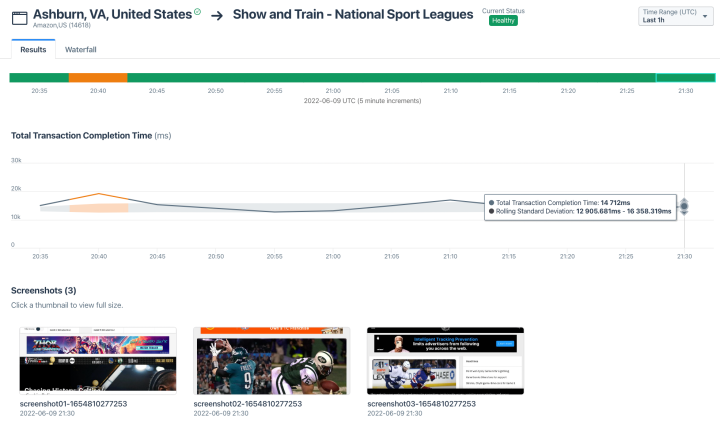
Emulate real user experiences
- Test page load times and user transactions (STM) from public or private agents.
- Mimic the experience your users are getting and pinpoint issues wherever they might be.
- Alert on performance issues, anomalies, and SLAs.
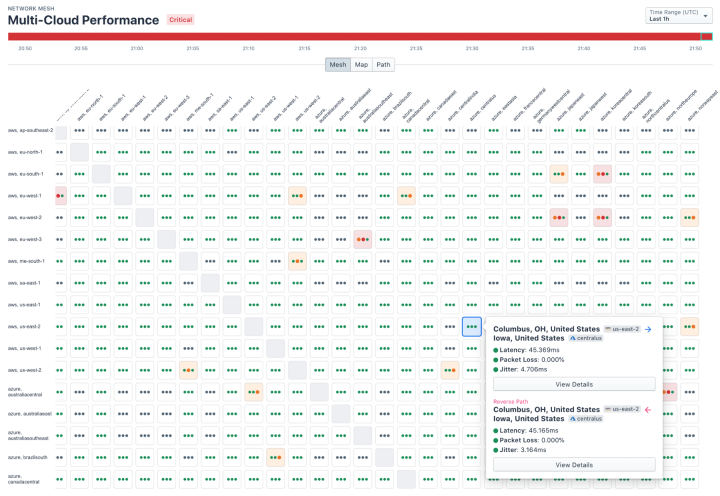
See the health of your entire network
- Instantly launch complex, multi-site performance mesh tests to see problems at a glance.
- Click any cell to view performance metrics and drill down to the root cause of issues.
- Understand how applications connect between data centers, campuses, and public clouds.
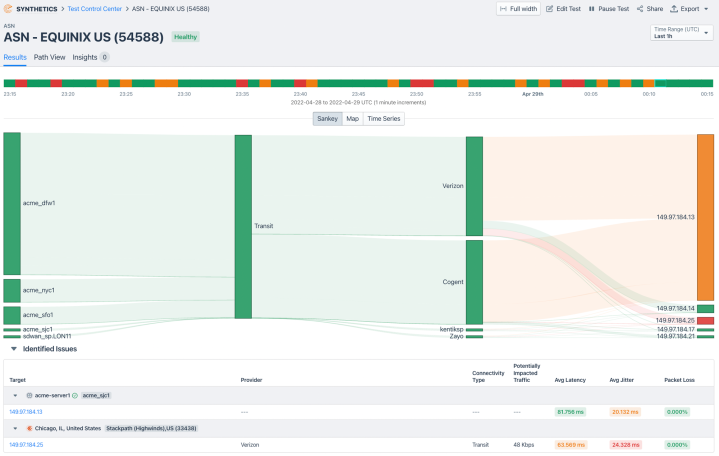
Visualize and examine delivery paths
- Visualize traffic paths and patterns as data flows from source to destination. Drill in to any level of detail.
- Get a hop-by-hop view that makes it easy to drill into the root of performance problems.
- Visualize AS paths, monitor route announcement frequency, and get alerted to changes.
See the status of SaaS applications at a glance
- Measure the performance of popular SaaS apps from hundreds of global locations.
- See key metrics such as response time, latency, jitter and packet loss.
- Monitor critical application infrastructure such as web or DNS servers.
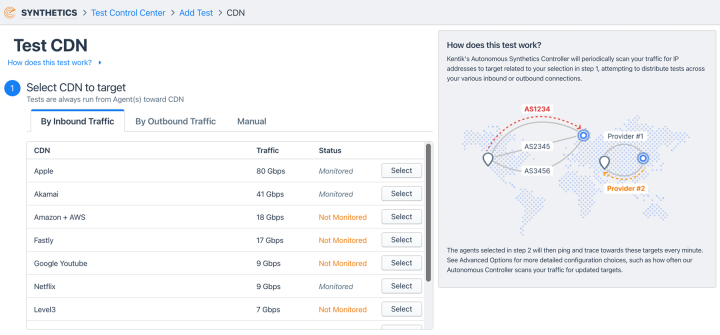
Gauge CDN performance
- Measure performance and track connectivity to CDNs or ASNs autonomously.
- See synthetic test results in the context of real traffic from content providers.
- Evaluate CDN performance using Kentik’s global CDN map and scenario testing capabilities.
Identify connectivity issues
- Understand user connectivity issues are related to VPN overload.
- See performance test metrics and traffic flows side-by-side.
- Quickly identify if there is a correlation between test results and traffic overload.
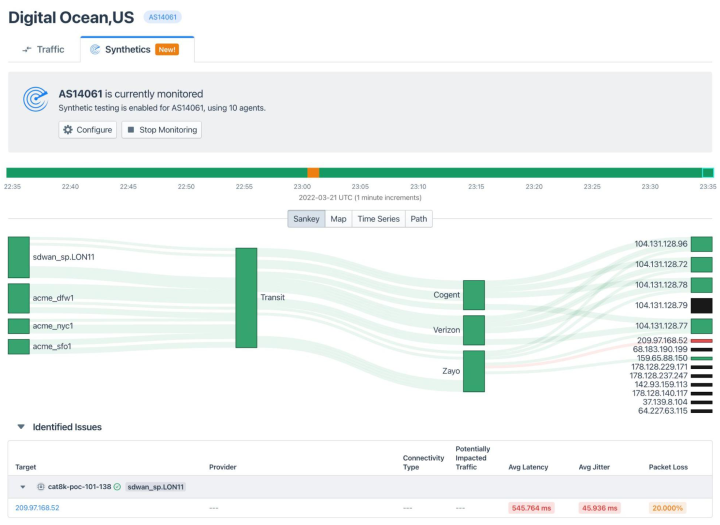
Real and test traffic together
- The only network observability solution that has real and synthetic monitoring in the one platform.
- See performance test metrics and traffic flows side-by-side.
- Quickly identify if there is a correlation between test results and traffic overload.
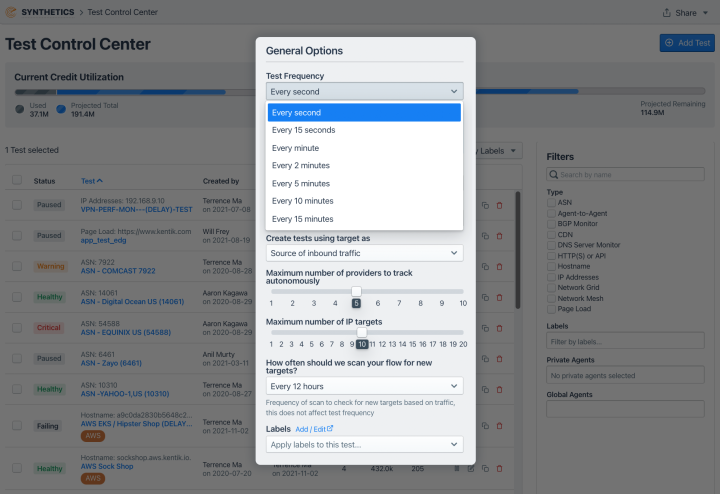
- Use real traffic to automatically set up synthetic tests.

“With the other tools we tried, we were paying for something that couldn’t do half of what Kentik Synthetics is able to do.”
Explore the platform
Digital Experience Monitoring FAQs
How can I measure quality of experience for VoIP and video across WAN links?
Measure QoE for voice/video by continuously tracking latency, jitter, packet loss, and path stability across WAN links and egress points, then correlating regressions with routing and traffic shifts. Kentik supports this by combining SD-WAN/WAN visibility with synthetic testing and path context so you can validate that real-time traffic stays on the best-performing routes.
How can I measure user experience for gaming and real-time apps?
Measure the performance signals real-time apps “feel” most, especially latency, jitter, packet loss, and route consistency, and capture them across the actual user egress paths and ISPs that serve your audience. Kentik supports this by combining synthetic tests and internet path context with traffic signals so you can isolate whether issues originate in the WAN, last mile, DNS, or upstream routing changes and verify improvements after remediation. See also: Synthetic Testing and Monitoring.
What’s the fastest way to find the root cause of elevated latency?
Use continuous synthetic testing to pinpoint where latency rises along the path, then correlate that time window with flow and device telemetry. Kentik Synthetics provides ping/traceroute measurements with path context (including AS paths), and Kentik correlates synthetic metrics with flow and SNMP monitoring so you can isolate whether the culprit is an interface, a routing change, an upstream segment, or a third-party endpoint.
How do I troubleshoot SaaS performance issues when the app is outside my network?
Troubleshoot external SaaS slowness by measuring DNS resolution, connectivity, latency, loss, and route changes from multiple vantage points, then isolating whether degradation is in the WAN underlay, SD-WAN steering, last mile, or upstream routing. Kentik supports this by combining synthetic testing for SaaS endpoints with path context so teams can prove where the bottleneck is and validate remediation or failover decisions. See also: Troubleshoot Any Network.
What tools provide visibility into SaaS application performance from the network perspective?
Tools provide SaaS performance visibility by measuring DNS, connectivity, latency, loss, and route stability to SaaS endpoints and correlating regressions with path and provider changes. Kentik supports this by combining synthetic tests for SaaS apps with network traffic and path context so teams can determine whether slowness is driven by WAN underlay, DNS, upstream routing, or SaaS-side degradation. See also: Synthetic Testing and Monitoring.

