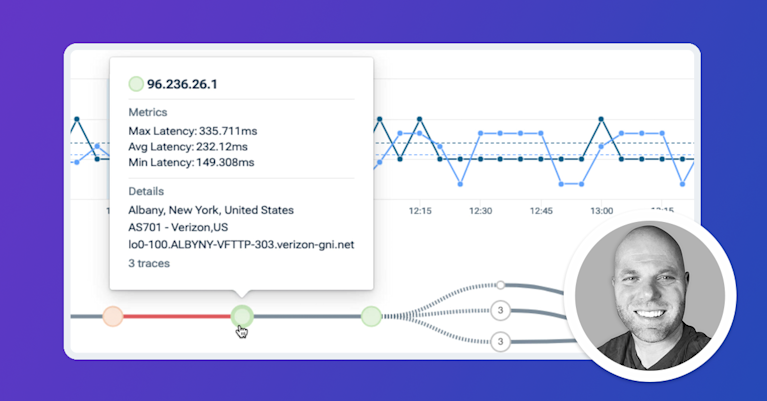
In most organizations, it's probably safe to say most people, even at home, are using SaaS applications pretty much every day. That could be activity tools, but also mission critical applications, entertainment, and almost anything else that you can think of. So it's important to monitor connectivity to these services as well as the quality of those connections, but that's easier said than done. So unless you actually work for one of these SaaS providers, we don't have insight into what's going on inside their networks when an application is performing poorly. We don't own Google's DNS service. We don't own Microsoft 365 or Salesforce or Zoom or whatever SaaS application. And this is where Kentik's State of the Internet comes in. The State of the Internet is part of Kentik's overall network observability platform and it's included for all of our customers to use. We've deployed hundreds of test agents around the world to monitor these providers continually for our customers and then report on the results right here in the Kentik portal. So notice that we have connection quality metrics for many of the most popular SaaS providers out there right here in this grid. We're capturing the HTTP status code, response size, domain lookup time, connection time, response time, the average HTTP latency, then the average latency which refers mainly to network latency, average jitter, and even packet loss. So we're capturing a variety of metrics here to gauge the quality of the connection from multiple perspectives, network, application layer, even DNS. So let's say that you have a problem with just one provider, you can get a quick view of these metrics right here on the main page. But you can also drill down further by clicking on the provider name and now you can see those metrics in a map. You can see them in a time series if that's helpful. You can also adjust your time range and then drill down further to see the detailed metrics and the path view for that specific provider. Now we're also monitoring the quality of connection to the major public clouds, AWS, Azure, GCP, and so on, which you can see here in this grid. And likewise, you can also drill down into any of these details from here. And lastly, we're monitoring the connection to and the resolution time of the major public DNS services like Cloudflare, Google, and Quad9. The State of the Internet is built with Kentik Synthetics, so you can create your own custom tests with very specific parameters to whatever application or service that you want to monitor. Internally, in your own cloud instances or on the public internet. For more information about the state of the internet and how Kentik can help you monitor SaaS application performance visit www.kentik.com/saas, and you can always speak to your local Kentik representative as well.


