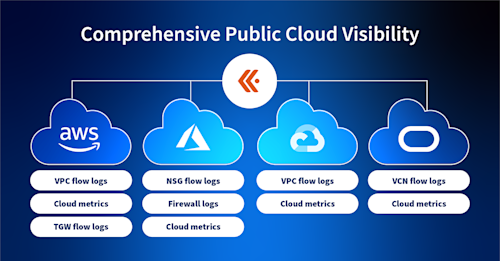
I'd like to show you a few ways that Kentik Cloud, which has extensive functionality with workloads in Microsoft Azure, can help you troubleshoot fast, optimize costs, and answer any question about your network across the major public clouds. When I don't have complete visibility into my hybrid and multi-cloud infrastructure, I may suspect performance problems, but it takes forever or else it's not possible to get the data that I need to be sure of the root cause and fix it. With environments that change frequently and involve many different types of resources from different vendors, the network is a common thread that connects them all. And network data is a common language that helps me fine-tune Azure cost and performance and solve problems quickly when they inevitably arise. When you're troubleshooting a problem with a workload that uses data or a service that comes through an ExpressRoute, so this could be traffic between your on-premises network and Azure virtual networks, so coming and going between virtual machines, storage accounts, it could be data replication or backup. ExpressRoute traffic can also be your private connection to Microsoft 365 or even private peering with your CDN. Given all the ways that ExpressRoutes can be used, it can be hard to figure out which ExpressRoute traffic is going through. You can use Kentik Cloud to get that information and to quickly rule out a problem with an ExpressRoute. In my Data Explorer, I'll choose Microsoft Azure as my data source. And I can add dimensions to my Azure traffic to see instance name, application context, and the ExpressRoute circuit name, plus whatever other attributes I want. Now you can see a lot of this traffic is east-west, so I'm going to filter it to try and look just at the southbound traffic. With my application context added, I can quickly see which ExpressRoute the traffic for this application, in this case, this is SNMP, is using. Also, this is a fifty meg circuit, so we can see that overconsumption is not a problem for this circuit today. I can find out more in the Kentik Map. Here at the top, I can see how on-prem is connecting through my ExpressRoutes. This Ashburn-Palo Alto firewall is connected to my ExpressRoute circuit, and here's the identifying data on that circuit. I can also get information on this Ashburn IPsec connection. I've got the tenant ID, the subscription ID, and some volumetric data. If I follow this route down, I can see that it connects into US East. So let's take a peek at these VNets. The team using 10.170.0.0 has had some problems in the past, so let's start there. I can see that 10.170 is utilizing that VNet gateway to Ashburn. Let's look at some traffic details from this subnet. I can visualize the internal traffic that's been using this ExpressRoute over the time period that I specify. I can also see which traffic is being dropped on this subnet. I can also use Kentik Map to inspect ExpressRoute metadata. When I have a problem with an ExpressRoute, these are the details that are hard to try to get to understand that problem. I can click into this ExpressRoute to see details such as dropped packets. And we're building this up at Kentik, adding more and more metadata so that you can have all the information that you need at your fingertips to solve fast. Sometimes when I'm troubleshooting a persistent performance issue, I want insight into how well a load balancer is balancing and routing traffic. I want to know if the algorithm is being applied properly and whether it's a good fit for my workload. Right now, I'm trying to understand if a particular load balancer may be contributing to performance issues, and Kentik can help me be sure. I can use the Data Explorer to filter Azure traffic and investigate. So these dimensions are the attributes or columns in Kentik's database of your enriched flow data that you can choose to show based on what you need to understand now. I'll add destination load balancer and destination instance name. And I'm going to filter, so I'm only seeing traffic that's going through a load balancer. And then I can isolate what's going through this particular load balancer too. And I can visualize this data in a way that helps me easily see that Libra's balancing the traffic pretty nicely. That's just one example of a question I can answer in seconds with Kentik. When you're managing your corporate network in the cloud, the environment may be changing frequently. It can be hard to keep track of the changes and how everything is connected. When something goes wrong, this makes troubleshooting tedious and slow. In Kentik Cloud, you can see an always up to date visualization of your hybrid Azure infrastructure's architectural blueprint, including your virtual WAN configuration. So if I have a ticket about the performance of a particular vWAN hub, I can click into it in the Kentik Map and see its identifying details. And I can see the utilization in and out. On both what's routed through 10.190/16 and on 10.160/16. And as for my VPN sites, in Brazil, I've got a VPN router, and I'm going to be talking to it it on 172.16.16, going over an AT&T circuit. This is my vWAN hub information right here at my fingertips in Kentik Cloud. When you're trying to cut Azure costs and limit the time that your team spends managing your Azure resources, it's critical to understand how your current architecture contributes to extra spend. When it comes to Azure Firewall, you may not know how many firewalls you need. In the Kentik Map, if I click on a subnet, I can see if it's using Azure Firewall. And I can see that firewall's metrics, and I can inspect them for the time range that I specify. I can see the hit counts of the firewall, both from network rules and from application rules. Since this firewall is not being utilized very much right now, we should consider consolidating the VNets using this firewall behind a different firewall. That's one way you can use Kentik to understand which firewalls to consolidate to lower your cloud bill. Cloud consoles don't make it easy to find out which subscriptions are associated with the top bandwidth hogs. In Kentik Cloud, I have created a custom dashboard that surfaces that surfaces the subscription ID for each Top Talker by interface and by subnet. So now I know how to allocate total Azure cost to each team or business unit, and I know who to follow-up with about usage based performance problems. This helps me make sure that our hybrid cloud networking is aligned to our business.
Gain comprehensive network observability across all multi-cloud deployments, unify network telemetry, unlock automated insights, and ensure no critical data goes unnoticed.
Platform
Solutions
- Reduce Cloud Spend
- Migrate To and From Any Cloud
- Improve Cloud Performance
- Optimize Enterprise WAN
- Network Performance Monitoring
- Deliver Exceptional Digital Experiences
- Detect and Mitigate DDoS
- Harden Network Policy Management
- Investigate Security Incidents
- Visualize All Cloud and Network Traffic
- Troubleshoot Any Network
- Understand Internet Performance
- Optimize Data Center Networks
- Consolidate Legacy Tools
- Optimize Peering and Transit
- Plan Network Capacity
- Reduce Network Spend
- Grow Subscriber Revenue


