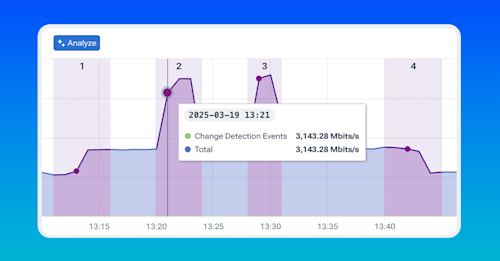
One of the most common questions asked when a network change is detected is, what changed? This could be because traffic spiked temporarily, traffic was rerouted, or some other anomaly that a user wants to investigate. The challenge is that identifying what change can be tricky. Doing this typically involves manually slicing traffic by various dimensions, evaluating the results, filtering on top values, and then adding more dimensions, repeating this process until a clear picture of what's driving the traffic change emerges. It's a repetitive and time consuming process even for someone with deep familiarity with the data which often involves trial and error. Kentik's new Cause Analysis eliminates this manual overhead. Using data mining and AI, Kentik Cause Analysis automatically identifies the most contributing dimensions to traffic and presents them in natural language saving you time and effort. It works best for analyzing relatively short time periods during troubleshooting scenarios. Let's take a look at how it works. Workflow one: traffic analysis. Now let's dive deeper into Kentik's Cause Analysis feature. This feature in Data Explorer supports three user workflows. First, let's look at the traffic analysis workflow. Suppose we notice an interesting spike or unusual traffic pattern. To investigate this traffic, we simply select a single time window on the graph and select Analyze Traffic. The results of Kentik's AI driven analysis will be shown in the additional Cause Analysis tab. There is a clear summary at the top highlighting the most significant contributing factors to the traffic during this period. Below the summary, we see detailed numerical results presented in an hierarchical table. These results are generated by Kentik's data mining algorithms and reveal the key dimensions contributing to traffic including applications, IP addresses, autonomous system numbers, ASNs, and cloud services. The table uses hierarchical representation and the larger groups of general dimensions usually contain other groups of more specific dimensions. Keep in mind the values shown here are estimates intended to quickly guide you towards the most relevant factors rather than exact measurements. In this particular example, we have identified two chunks of traffic that are contributing to the total traffic, one with forty five percent and another with twenty percent. To be able to identify these groups or traffic and see how they contribute to the total traffic, users are able to select a particular group in the table and view its time series in another Data Explorer window opening in a new tab. This new Data Explorer window will have a filter with all of the specific values of the identified traffic. In this particular example, we can see that the traffic pattern does not correspond to the traffic spike we are looking for. When selecting another group of contributing traffic, we can correlate the traffic pattern with the spike we are trying to identify. Workflow two: traffic comparison analysis. Next, let's explore the traffic comparison analysis workflow. This workflow addresses the issue of traffic pattern identification that we encountered in the first workflow. Imagine that we want to understand what changed between two different periods. To do this, we select two separate time windows on the graph. Cause Analysis will automatically compare these two windows regardless of the order that we select them. Kentix AI summarizes the most significant factors contributing specifically to the traffic increase between these two periods. Below the summary, the hierarchical table clearly shows the dimensions that changed significantly along with the estimated magnitude of these changes. This helps us quickly pinpoint exactly what changed such as a new source IP, a different application, or a shift in traffic routing. In this particular example, we see that the Apple update traffic which is identified as additional increased traffic between two selected windows is coming from two different source IP addresses. By selecting each of them, we can confirm their traffic patterns. We can identify that one of these IP addresses is contributing to the traffic only in the second traffic spike we are analyzing. This workflow is particularly useful when troubleshooting traffic increases or assessing the impact of network changes. Workflow three: Automatic detection and analysis of traffic changes. Finally, let's look at the automatic detection of traffic changes and analysis workflow. In this scenario, we don't need to select time windows manually instead we simply click the Cause Analysis button at the top of the chart or the bottom of the query panel. Kentik automatically scans the entire time series and identifies up to five significant traffic changes such as spikes, drops, or sudden jumps. These detected changes are clearly marked on the chart. Below the chart, we see a summary table listing each detected change including the type of change, its magnitude, the exact time it occurred and a Kentik AI generated summary of the change. Clicking on any of these changes expands the view providing a detailed hierarchical breakdown of the contributing dimensions. In this particular example, besides the obvious traffic spikes on the chart, Kentik Cause Analysis detected a traffic increase of approximately six hundred megabits per second, which is associated with the specific file storage application. Two spikes related to the Apple update that we previously analyzed are also detected. Additionally, after the storage transfer was completed, Cause Analysis detected a drop in the same traffic. This automated workflow is especially helpful for proactively identifying and understanding unexpected network events without manually hunting through data and makes these workflows even simpler. On the right hand side of the query panel an additional section is dedicated to Cause Analysis configuration. There are a few simple configuration parameters that can adjust the Cause Analysis and make it more or less sensitive to traffic changes allowing it to provide even better results. Device traffic increase insight. Before we wrap up, let's quickly look at how Cause Analysis is integrated into Kentik Insights specifically within the device traffic increase insight. Kentik Insights automatically detects significant traffic increases on your network devices. Here, we have an example of a detected traffic increase event on a specific device. When we open this insight, we immediately see a clear visualization of the traffic increase including when it started and how it compares to historical traffic patterns. Below the chart, Kentik Cause Analysis provides an AI generated summary explaining the most likely reasons behind this increase. It highlights key contributing factors such as specific applications, source and destination IP addresses, and interfaces involved. Further down, we see detailed numerical results in an hierarchical table clearly showing the dimensions that contributed most significantly to the increase in traffic. This helps us quickly understand the nature of the event and guides us towards appropriate next steps. This integration of Cause Analysis into Kentik Insights makes it even easier to proactively identify, understand, and respond to important network events. To summarize, Kentik's Cause Analysis feature in Data Explorer provides network engineers with a powerful, intuitive way to quickly understand network traffic anomalies. Whether you're analyzing a single event or automatically detecting significant changes, Cause Analysis helps you rapidly pinpoint the most relevant factors behind traffic fluctuations. We hope this demo has been helpful. For more information, please visit our documentation or reach out to your support team. Thanks for watching.


