Complete Hybrid and Multi-Cloud Network Observability
Empower teams to answer any question about cloud traffic, connectivity, or performance.
Understand hybrid cloud connectivity and health
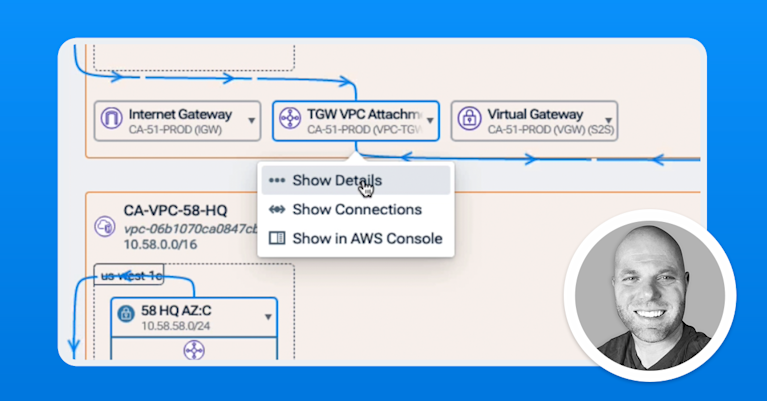
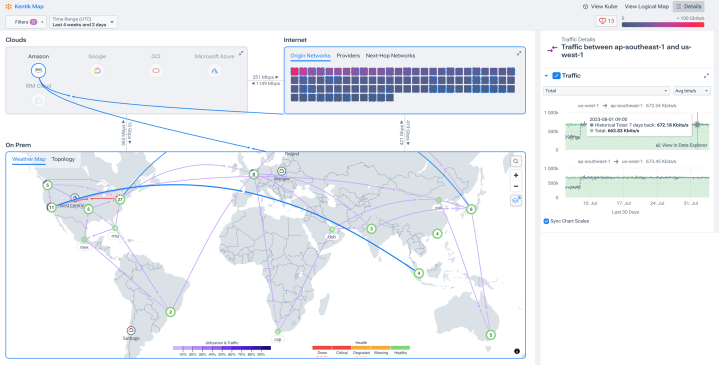
- Visualize infrastructure from data center to AWS, Azure, Google Cloud, OCI, and IBM Cloud environments in an interactive, context-rich map.
- Instantly see cloud resource topology and interconnects to data center environments with an automated source of truth.

Get alerts on critical anomalies and insights
- Find out about compliance and security risks that matter to your business immediately with custom alerts.
- Know where your traffic is going, and whether inter-region data exchange is compliant.
- Automatically flag communication with watchlisted hosts.
Troubleshoot instantly with Connectivity Checker
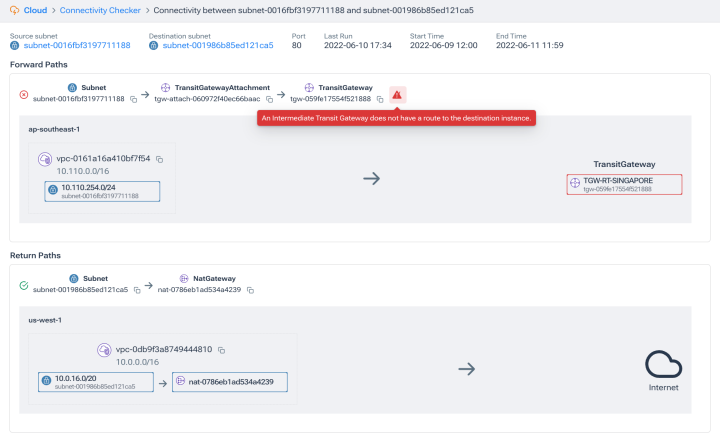
- Check live connectivity between any instance, subnet, or network interface on demand.
- Get detailed insights into connectivity problems with visualization of where connectivity is blocked.
- Search by IP, CIDR block, VPC ID, Subnet ID, or DNS name to quickly pinpoint connectivity.
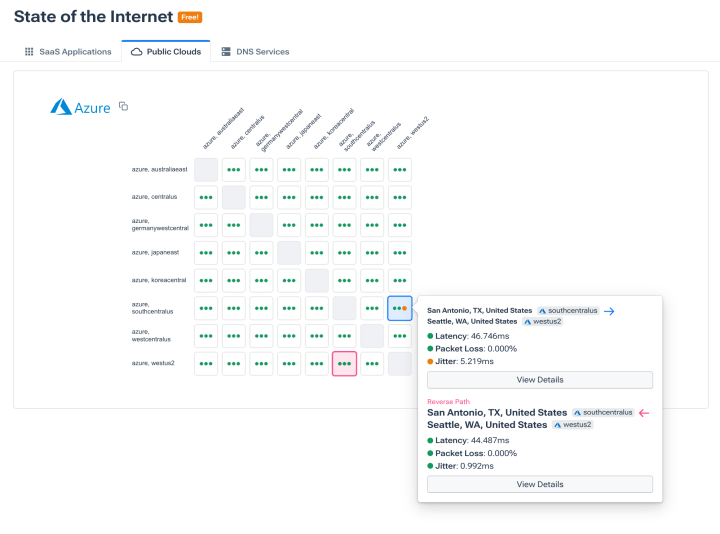
See public cloud performance, uptime, and connectivity
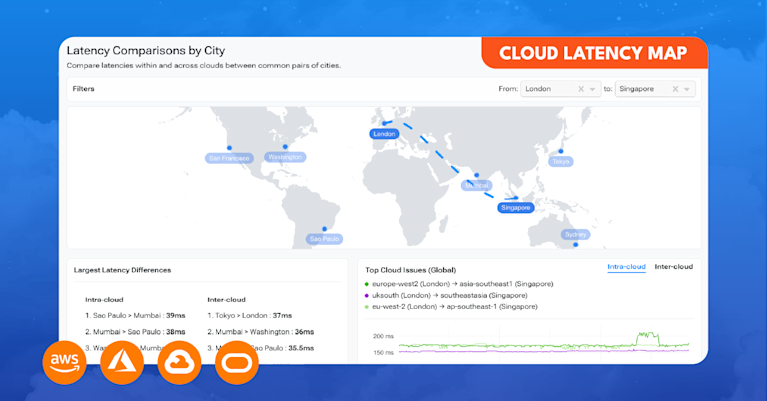
- Check Kentik State of the Internet to identify cloud provider latency and outages across regions and products.
- Quickly troubleshoot SaaS and external dependency issues with real-time status of SaaS companies and DNS Services.
- Configure global synthetic tests to detect issues with mission-critical upstream services.
Excel at cloud migration
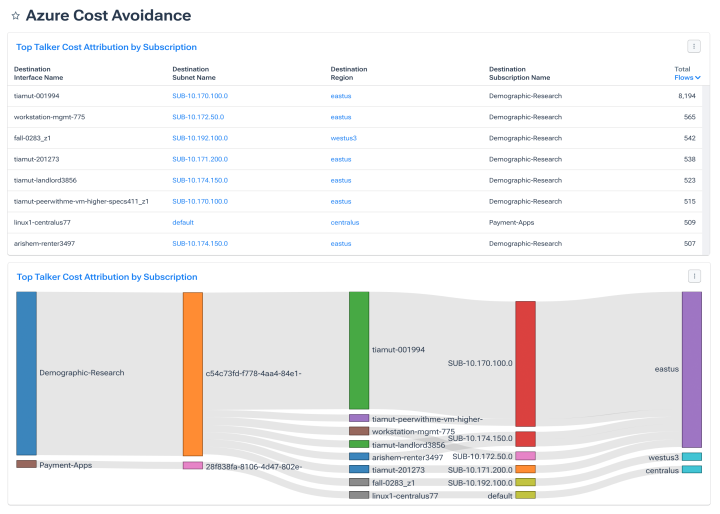
- Quickly optimize customer experience with insights from synthetic tests and real-time, hybrid cloud traffic data.
- Automatically analyze cloud usage trends and attribution to fine-tune cloud capacity and redundancy.
- Analyze traffic before, during, and after migration to balance performance with cost.
Rapidly interrogate network data in Data Explorer
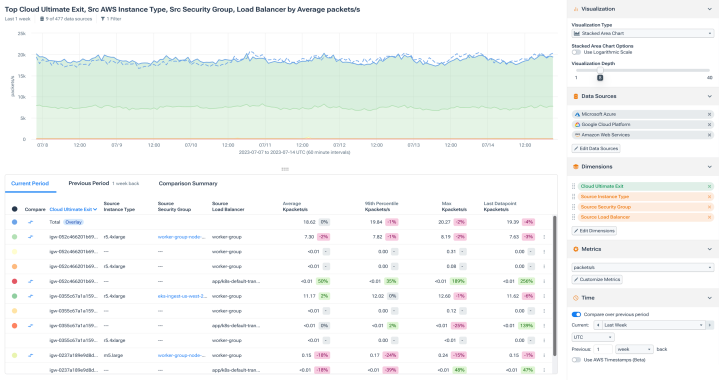
- Get instant answers to “unknown unknowns” with blazing-fast queries of network and infrastructure data from all your clouds.
- Understand, compare, and visualize real-time and historical connectivity and performance.
- Automatically enrich data with your business, application, and security context.
“Kentik is actually showing you a visual representation of how your physical equipment connects via those virtual private connections in the cloud.”
Hybrid and Multicloud Network Observability FAQs
How do I get end-to-end visibility across hybrid and multi-cloud networks?
End-to-end visibility comes from combining three things: traffic telemetry (including cloud flow logs), topology and routing context, and proactive testing that shows performance even when traffic is sparse. Use a single model that lets you correlate what changed (routes/policy/paths) with what users experienced (latency/loss/jitter) across on-prem, cloud, and internet segments.
How do I visualize hybrid and multi-cloud connectivity and health in one place?
Use an interactive map that shows how your data center, cloud regions, and interconnects relate, then overlay traffic and health so you can understand what’s connected and what’s changing. Kentik provides a context-rich map view for hybrid and multi-cloud environments so teams can troubleshoot and plan from a single source of truth. See: Kentik Map
How do I troubleshoot why two cloud endpoints can’t reach each other?
Start with a connectivity workflow that visualizes the forward and return paths and highlights where routing, NACLs, or security groups block traffic. Kentik’s Connectivity Checker feature can show where connectivity is failing so you can fix the specific policy or gateway that’s misconfigured. See: Cloud Pathfinder
How do I detect traffic to unsanctioned cloud services?
Use flow-based monitoring to classify and baseline outbound destinations, then alert on new or unusual cloud services. Kentik ingests cloud flow logs and on-prem flow and can surface changes in top cloud service traffic and unexpected destinations via queries, dashboards, and Insights.
Which public clouds does Kentik support for multi-cloud observability?
Multicloud observability should cover the major providers you run today and the ones you may adopt next. Kentik supports visibility across major public clouds and provides cloud monitoring workflows to register and manage cloud resources in the portal. See: Public Clouds
How can I detect compliance and security risks in cloud traffic?
Use alerts that focus on what matters: where your traffic is going, whether inter-region data exchange aligns with policy, and whether workloads communicate with watchlisted destinations. Kentik supports custom alerts and can automatically flag communications with watchlisted hosts to speed investigation and response. See: Using Threat Feeds
How can I tell if cloud provider latency or outages are causing my issues?
Check independent, continuous measurements across cloud regions so you can separate “my network” from “the provider” quickly. Kentik State of the Internet provides at-a-glance visibility into cloud performance and availability signals that can explain sudden latency spikes or regional incidents. See: State of the Internet
How do I troubleshoot SaaS and external dependency problems (including DNS) from anywhere?
Monitor SaaS performance, DNS resolution, and path behavior from multiple global vantage points to pinpoint whether the degradation is upstream, regional, or destination-side. Kentik’s State of the Internet capabilities help teams identify issues affecting SaaS providers and external dependencies without guessing. See: State of the Internet: Monitoring SaaS Application Performance
How can I de-risk cloud migrations and avoid surprises during cutovers?
Use a before/during/after approach: baseline traffic and dependencies, watch performance during migration, and validate that connectivity and user experience remain stable after cutover. Kentik combines real-time hybrid visibility and testing signals so teams can balance performance, cost, and risk throughout cloud migration. See: Cloud Migration
How do I optimize cloud networking costs using traffic and attribution?
Start by attributing traffic to the places costs accrue (regions, services, gateways, and interconnect paths), then find the traffic slices driving the biggest spend so you can redesign routing, placement, or connectivity. Kentik provides cost workflows that estimate and analyze the cost impact of specific traffic slices for optimization decisions. See: Traffic Costs
How do I investigate multi-cloud traffic and performance quickly when something changes?
Use a query workflow designed for “unknown unknowns” so you can pivot fast across clouds, time windows, and enriched context (business, application, and security). Kentik Data Explorer enables rapid, query-based exploration of flow and related telemetry so teams can compare real-time and historical behavior. See: Data Explorer
Can Kentik monitor AWS, Azure, and Google Cloud networks in one view?
Yes. Kentik unifies visibility across AWS, Azure, and Google Cloud and ties cloud topology to traffic and connectivity data, so you can go from a global view to the exact VPC/VNet/subnet, interconnect, or gateway involved. This helps teams troubleshoot faster and keep a consistent operational picture as architectures change.
What tools can detect cloud routing anomalies automatically?
Tools that detect cloud routing anomalies automatically combine cloud flow logs and topology context with active connectivity checks so they can spot misroutes, blocked paths, and misconfigurations as they happen. Kentik supports this with multicloud observability features and Connectivity Checker, which helps teams visualize where connectivity is blocked and correlate cloud connectivity changes to performance and traffic impact.
What tools enable rapid RCA for multi-cloud application outages?
Rapid RCA usually requires correlating three views: (1) active testing to confirm whether the outage is global, regional, ISP/path-specific, or destination-side, (2) topology and connectivity analysis to pinpoint where traffic is blocked (routes, security groups, NACLs, gateways, asymmetric paths), and (3) “what changed?” analysis to identify the specific traffic dimensions, paths, or dependencies that shifted right before impact; for application-layer faults, pair this with APM/tracing to confirm whether the bottleneck is in code or infrastructure. Kentik supports rapid RCA across hybrid and multi-cloud environments by combining global synthetic tests, on-demand Connectivity Checker path analysis, and fast investigation workflows in Data Explorer, with Kentik AI features like Cause Analysis and AI Advisor to accelerate change triage and guided troubleshooting.
Learn more about multicloud visibility
Learn more about hybrid and multicloud visiblity in our articles about:


