OTT Services (Over-the-Top Services)
Over-the-top (OTT) services are transforming the way we consume content, from long-form streaming video and live sports to gaming, short-form creator video, and social media platforms. As adoption grows and business models shift toward ad-supported streaming and free ad-supported TV (FAST), network operators need clear visibility into how these services traverse their networks, affect subscriber experience, and drive connectivity and peering costs.
In this article, we explore what OTT services are, how the OTT landscape is evolving in 2025, and how Kentik helps service providers and other operators monitor, manage, and analyze these services to optimize network performance, subscriber experience, and cost.
What are OTT (Over-the-Top) Services?
OTT (short for “Over-the-Top”) services are internet-based content and application platforms that bypass traditional distribution channels such as cable or satellite television. They enable users to access content directly from a provider over IP, without needing a separate cable or satellite service subscription. Examples include Netflix, Disney+, Amazon Prime Video, YouTube, TikTok, Spotify, and many others.
These services are typically delivered via streaming or interactive protocols and can be accessed from a wide range of devices, including smart TVs and connected TV (CTV) devices, smartphones, tablets, laptops, game consoles, and dedicated streaming devices like Roku, Apple TV, or Chromecast.
OTT services are sometimes referred to as “over-the-top streaming” or “over-the-top media” services, but these terms all describe the same basic concept.
The term “over-the-top” refers to the way these services are delivered “on top” of physical network infrastructure as IP-based services. OTT providers deliver audio, video, communications, and other media over broadband and mobile networks operated by service providers such as ISPs, MSOs, and telcos, often without direct control by those network operators.
Types of OTT Services
OTT services can be broadly categorized into the following types:
-
Subscription & transactional video-on-demand (SVOD / TVOD): On-demand catalogs of movies, series, documentaries, and premium video content. Examples include Netflix, Amazon Prime Video, Hulu, Disney+, and Apple TV+.
-
FAST and AVOD streaming: Free ad-supported TV (FAST) channels and ad-supported video-on-demand (AVOD) libraries that mimic traditional linear TV guides or themed channels. Examples include Pluto TV, Tubi, The Roku Channel, and Freevee.
-
Live TV & event streaming: Internet-delivered live channels and event streams, including sports, news, and pay-per-view. Examples include YouTube TV, Hulu + Live TV, and live events streamed through services like Peacock or Netflix for major sports and entertainment moments.
-
Short-form and creator video platforms: Services focused on short-form, user-generated, or creator-led video, often optimized for mobile and social discovery. Examples include YouTube, TikTok, Instagram Reels, and Snapchat.
-
Audio and podcast streaming: Music, radio, and podcast platforms that deliver audio content over IP. Examples include Spotify, Apple Music, Pandora, and podcast aggregators.
-
Gaming and cloud gaming services: Platforms that distribute games via downloads or stream gameplay directly from the cloud. Examples include Microsoft Xbox Game Pass / Xbox Cloud Gaming, Nvidia GeForce NOW, Valve’s Steam, and publisher-operated launchers and services.
-
Communication and collaboration services: OTT voice, video, and messaging tools used by consumers and enterprises. Examples include WhatsApp, Zoom, Microsoft Teams, and Webex.
-
Social media platforms: Social networks that blend messaging, media sharing, short-form video, and live streaming. Examples include Facebook, Instagram, and X (formerly Twitter).
As the internet continues to evolve, new OTT categories and platforms keep emerging, combining video, social, and interactive experiences in ways that drive new demands on network capacity, performance, and cost.
OTT in 2025: Key Trends for Network Operators
From a network and service provider perspective, several OTT trends stand out in 2025:
-
Growth of ad-supported and FAST streaming: Viewers are increasingly embracing free and ad-supported streaming options, as well as ad tiers on premium SVOD services, to control subscription costs. Industry research shows strong year-over-year growth in viewing hours on ad-supported and FAST platforms, and continued adoption of ad-supported tiers from major SVOD providers.
-
Shorter subscription stacks and more bundling: After years of “subscription stacking,” many households are consolidating their paid streaming services and relying more on bundles, aggregators, and free options. Surveys highlight that a significant share of consumers feel they pay too much for streaming and are more willing to churn or downgrade than in previous years.
-
Rise of social video and creator-led content: Gen Z and younger millennials spend a large portion of their daily media time on social platforms and user-generated video, often more than on traditional streaming services. For network operators, this means OTT is not just about long-form TV and film, but also about high-volume short-form video and mixed traffic patterns across CDNs and social platforms.
-
Cloud gaming and interactive experiences: Cloud gaming, interactive live streams, and real-time collaborative applications add jitter-sensitive, high-bitrate traffic profiles that are different from traditional buffered video, increasing the importance of latency and packet loss on top of pure throughput.
-
Live event spikes and traffic surges: Exclusive live sports and marquee entertainment events delivered via OTT can generate multi-fold traffic spikes for a single service or CDN, putting short-term stress on peering links, transit, and embedded caches. Kentik has documented this in analyses of major sports events and high-profile releases on services like Peacock and Netflix.
These dynamics make it critical for broadband and mobile providers to see not just “video traffic,” but the specific OTT services, CDNs, and connectivity paths involved, in order to protect subscriber quality of experience (QoE) and manage cost.
Learn how AI-powered insights help you predict issues, optimize performance, reduce costs, and enhance security.
Kentik’s OTT Service Tracking Solution
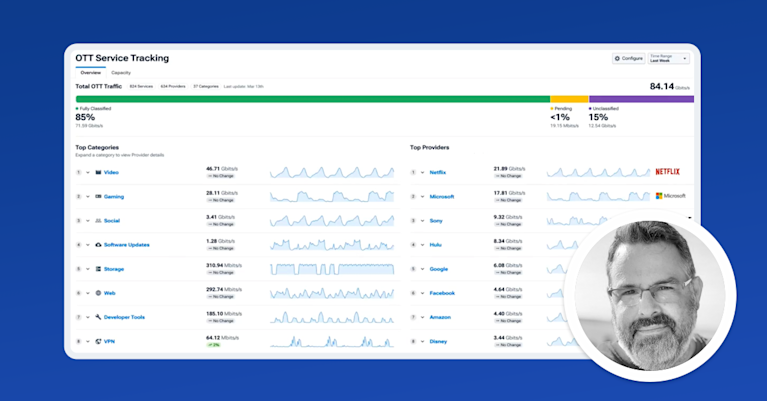
Kentik’s OTT Service Tracking module enables organizations to monitor traffic for various categories of OTT services such as video, gaming, social media, and communications. It associates flows with specific OTT services and providers, helps network teams understand which applications subscribers are using, and shows how that traffic enters and traverses the network.
This makes it easier to:
- Correlate performance issues to specific OTT services, CDNs, or connectivity types
- Evaluate the competitiveness of in-house offerings versus third-party OTT services
- Understand usage patterns across customer segments to refine plans and pricing
- Support customer service and marketing with concrete data about subscriber OTT usage
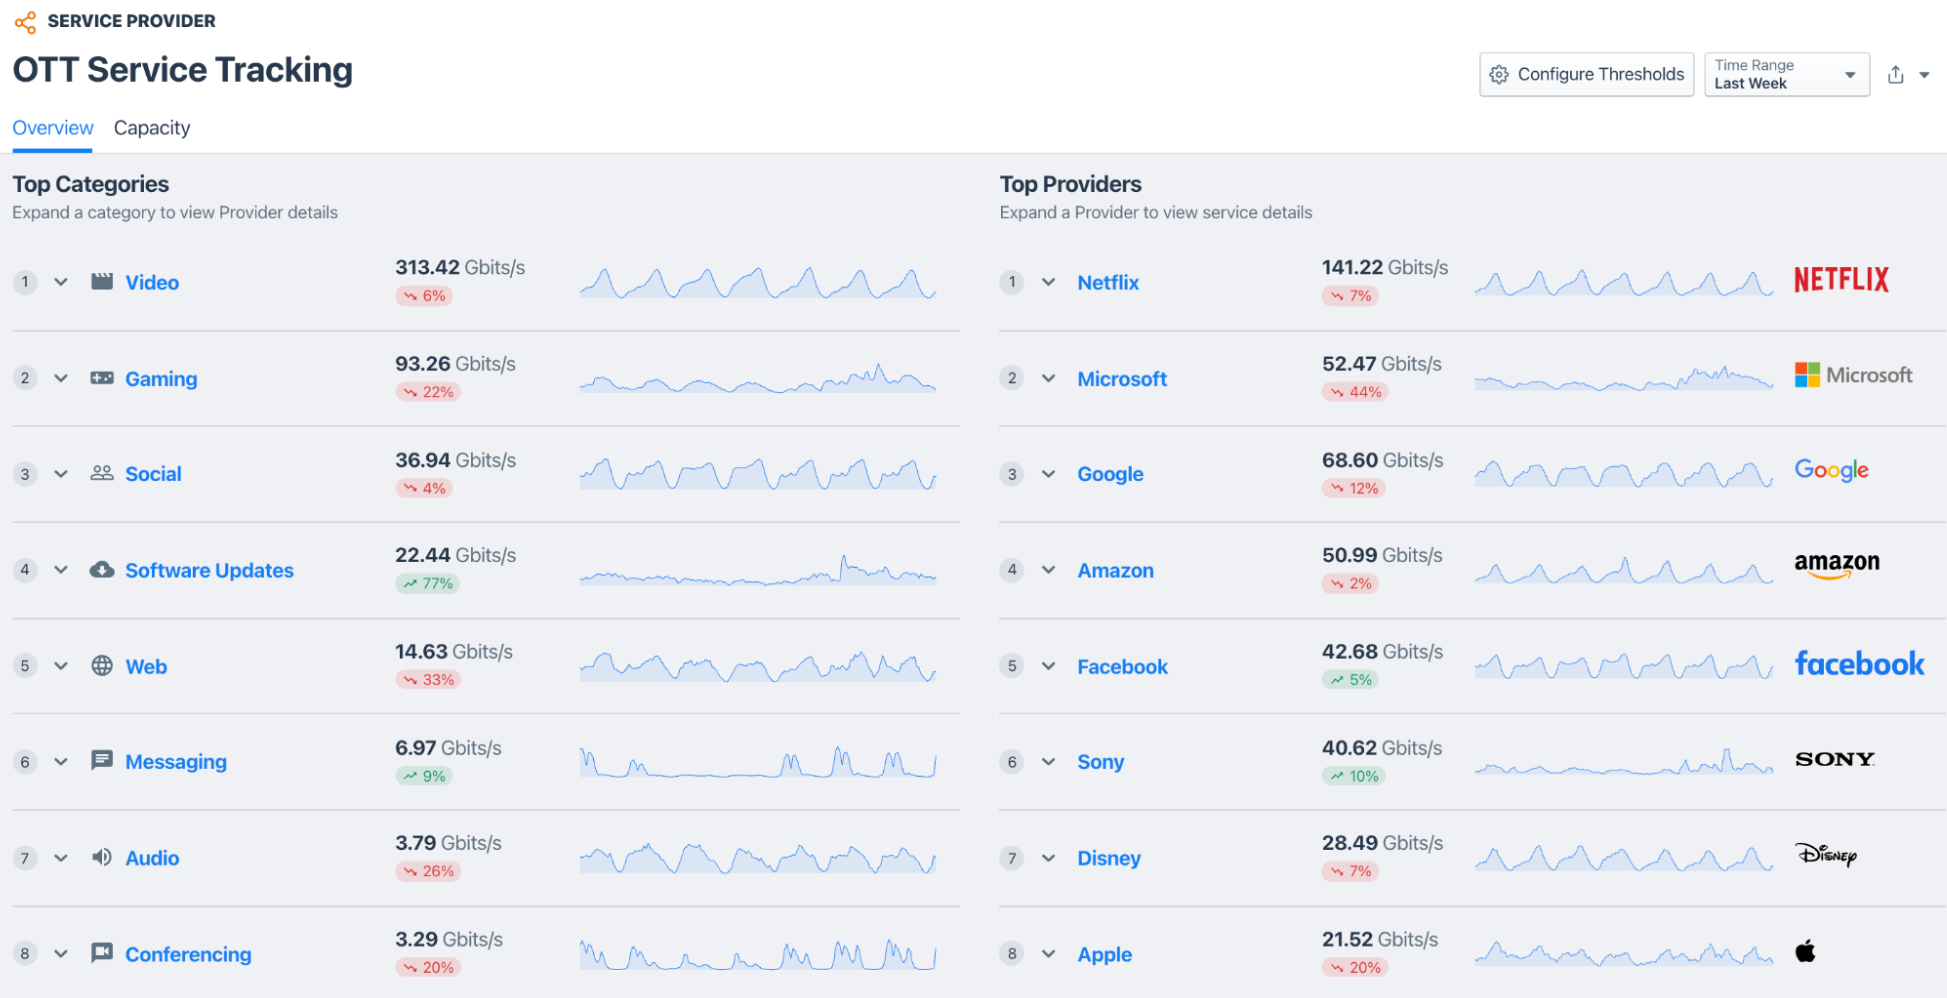
Kentik’s OTT Service Tracking workflow is available directly from the Kentik portal and is closely integrated with other workflows such as Network Explorer, CDN Analytics, Capacity Planning, and Traffic Costs.
Kentik OTT Engine (True Origin)
The OTT Service Tracking workflow is powered by Kentik’s True Origin engine. True Origin identifies OTT traffic sources by evaluating and correlating multiple telemetry streams, including flow records and DNS data. It classifies each flow into three key OTT dimensions:
- OTT Service Name (for example, Netflix, Disney+, TikTok)
- OTT Service Category (such as video, gaming, social, audio, or communications)
- OTT Provider Name (for example, Netflix, Meta, Amazon)
To perform this classification, True Origin correlates subscriber DNS requests with subsequent flows and uses an evolving catalog of patterns to map traffic to OTT services and CDNs.
True Origin now detects and analyzes the DNA of more than 1,000 categorized OTT services delivered by 79 CDNs in real time, without requiring deep packet inspection (DPI) appliances behind every edge port.
Each OTT-enriched flow gets an associated classification value that indicates how precisely True Origin has identified the traffic (for example, fully classified, provider-only, pending, or unclassified). This helps operators understand where classification is exact and where True Origin is still learning or refining its mapping.
OTT Service Tracking Metrics
Kentik’s OTT Service Tracking module presents a variety of metrics about OTT traffic, derived from both SNMP and flow records:
-
Capacity metrics: On the Capacity tab, traffic bitrates and utilization levels are based on SNMP OID polling. For each interface involved in delivering a given OTT service, the workflow shows maximum bitrates during the highest-traffic portion of the selected time range, allowing operators to see where OTT traffic is driving utilization.
-
Traffic and performance metrics: Other values such as total traffic volume, bitrates over time, and top services/providers are derived from flow data (for example, NetFlow), enriched with DNS-based classification from True Origin. Operators can slice these metrics by OTT service, service category, provider, connectivity type, geography, and subscriber segment.
By combining these datasets, OTT Service Tracking helps organizations understand not just how much OTT traffic they have, but also who it is from, how it is delivered, and how it affects the network.
Capacity Planning and OTT Services
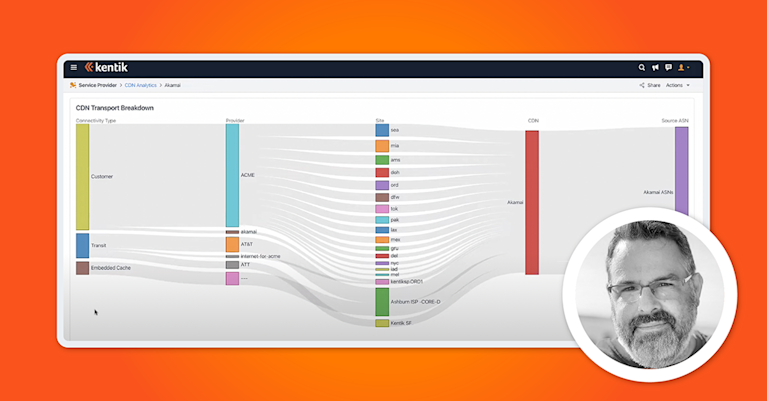
OTT content providers use a variety of methods to deliver traffic to ISPs and other network operators, including embedded caches, private peering, transit, and multiple commercial CDNs. This complexity can make it difficult to answer seemingly simple questions such as “Where is this Netflix or TikTok traffic actually entering my network, and which interfaces are close to saturation?”
Kentik’s OTT Service Tracking workflow includes a Capacity view that focuses on this challenge. For any OTT service or provider, the Capacity tab:
- Shows a treemap-style visualization of the interfaces carrying that service’s traffic, with blocks sized by traffic share and colored by utilization or health
- Highlights over-utilized or at-risk interfaces using health indicators consistent with Kentik’s broader capacity planning features (for example, Healthy, Warning, Critical)
- Allows network operations teams to quickly see where to add capacity, adjust routing, or negotiate different interconnection strategies with CDNs and transit providers
This view helps operators move from raw traffic measurements to actionable capacity plans specifically tied to OTT demand.
Subscriber Insights and OTT QoE
In addition to network-facing metrics, OTT Service Tracking provides insight into subscriber behavior and experience:
- The Subscribers view uses unique destination IPs as a proxy for subscriber IPs to estimate the number of subscribers per OTT service over time.
- For each service, operators can see how subscriber counts, average bitrates per subscriber, and performance metrics vary over time, by site, or by connectivity type.
- This gives broadband providers a subscriber-level view of OTT quality of experience (QoE) without deploying probes or DPI appliances.
With this information, operators can:
- Identify performance issues that affect only certain subscriber segments, sites, or access technologies
- Understand how changes in peering or capacity impact subscriber experience for specific OTT brands
- Support customer care with concrete data about the services and conditions behind complaints
Benefits of Monitoring OTT Services with Kentik
By leveraging Kentik’s OTT Service Tracking, organizations gain the ability to see and act on OTT traffic in ways that improve subscriber experience, cost control, and competitive positioning. Key benefits include:
-
Understand the impact of OTT services on your network: See which OTT services, providers, and CDNs are consuming capacity on specific interfaces, sites, and regions, and how that traffic has grown over time.
-
Correlate OTT traffic with performance and customer experience: Tie performance issues (such as buffering, low bitrates, or congestion) to the OTT services and delivery paths involved, enabling more precise troubleshooting and communication with subscribers.
-
Evaluate in-house versus third-party offerings: Compare usage of your own video or application services with third-party OTT providers and assess where there may be opportunities to improve or adjust your product strategy.
-
Refine plans and pricing based on usage: Analyze OTT usage across subscriber segments, geographies, or access types to inform zero-rating decisions, premium packages, and targeted offers.
-
Analyze suspicious OTT-related traffic: Identify patterns of suspicious traffic from or between users, or traffic anomalies associated with particular OTT services, to assess potential legal liability or security risk.
-
Alerting and proactive operations: Use thresholds and policies to be notified when OTT services or providers experience performance degradation, unexpected traffic surges, or changes in delivery patterns.
OTT Traffic and Cost Intelligence
OTT services and CDNs are a major driver of connectivity costs for many broadband and mobile operators. Kentik’s Traffic Costs workflow provides real-time, flow-based cost estimates for granular traffic slices, including individual OTT services, CDNs, transit providers, and subscriber segments.
By combining Traffic Costs with OTT Service Tracking and True Origin, operators can answer questions such as:
- How much does traffic from a particular streaming or social video service cost across transit versus private peering?
- What is the cost impact of exclusive live events or new FAST services in specific markets?
- Where would shifting traffic to different CDNs or connectivity types reduce cost without degrading performance?
This cost intelligence helps operators design peering, caching, and connectivity strategies that account for both subscriber QoE and financial outcomes.
AI-Assisted OTT Troubleshooting and Planning
Kentik’s AI Advisor is an advanced AI agent that deeply understands your network, reasons through complex issues, and delivers clear guidance for designing, operating, and protecting infrastructure at scale. It uses Kentik’s unified, enriched network data, including OTT and CDN analytics, to investigate issues and answer natural-language questions.
Because AI Advisor has access to OTT Service Tracking, network teams can ask questions like:
- “Which OTT services were saturating peering with Provider X last night?”
- “Where did subscriber performance for Netflix or TikTok drop during last night’s peak?”
- “Which OTT traffic is driving the highest transit costs this month?”
AI Advisor then builds a plan, queries Kentik’s telemetry and workflows (including OTT Service Tracking and Traffic Costs), and returns explanations and suggested next steps.
Video Overview of the Benefits of Kentik’s OTT and CDN Analytics Solutions
In this short video, Kentik experts provide an overview of what OTT services are and the benefits of Kentik’s OTT and CDN analytics features:
Takeaways from this video include:
- Kentik’s OTT and CDN analytics provide a deeper understanding of application activity on a network, going beyond simply seeing data to understanding why a network or application is behaving a certain way.
- Kentik uses flow data (such as NetFlow), BGP data, SNMP data, DNS telemetry, and other sources to provide visibility into OTT services and CDN delivery, avoiding the costs and operational complexity of DPI.
- OTT and CDN analytics allow operators to map services to physical network infrastructure, uncover traffic types, providers, volumes, and delivery methods, and view key performance indicators such as bitrates per subscriber.
- This visibility has practical applications, such as planning capacity for popular OTT services, optimizing CDN mix and interconnection, and reducing support costs by quickly isolating the source of subscriber issues.
How Kentik Helps Track, Monitor, and Manage OTT Services
OTT services are now a central part of today’s internet landscape, encompassing everything from premium streaming video and live sports to gaming, social video, messaging, and collaboration. As OTT usage grows and diversifies, the need for operators to effectively monitor, manage, and analyze these services on their networks becomes essential for:
- Maintaining subscriber quality of experience (QoE)
- Controlling connectivity and peering costs
- Supporting product and marketing strategies with real usage data
- Protecting the network and subscribers from abuse
Kentik’s OTT Service Tracking, powered by True Origin and integrated with other Kentik workflows such as Network Explorer, CDN Analytics, Capacity Planning, Traffic Costs, and AI Advisor, offers a comprehensive solution to these challenges.
To learn how Kentik can benefit your organization, request a demo or sign up for a free trial today.
FAQ: OTT Services and Monitoring with Kentik
How can ISPs monitor OTT services without deploying DPI appliances?
Kentik uses flow telemetry (for example, NetFlow) enriched with DNS data and a maintained catalog of provider and hostname patterns to classify OTT services and CDNs in real time, without requiring DPI boxes at every edge location.
What is the difference between an OTT service and a CDN in Kentik?
OTT services represent the applications and content brands that subscribers interact with (for example, Netflix or TikTok), while CDNs are the delivery infrastructure that carries that content (for example, commercial or content-owner CDNs). Kentik provides separate OTT and CDN analytics workflows so operators can see both the “who” (OTT brand) and the “how” (CDN and connectivity).
How does Kentik handle new or unknown OTT services?
Traffic that cannot yet be fully matched to a known OTT service can be marked as “Pending” or “Provider-only” while True Origin continues to learn and refine its mappings. Operators can still see and analyze this traffic and are automatically upgraded to more precise classifications as the catalog evolves.
Can Kentik show the cost impact of OTT and CDN traffic?
Yes. With the Traffic Costs workflow, operators can assign cost models to different connectivity types and providers and then estimate the cost of specific OTT or CDN traffic slices over time, helping align capacity, routing, and peering decisions with financial goals.
How do I analyze OTT traffic patterns to optimize network spend?
Analyze OTT patterns by attributing traffic to the correct OTT services/providers/CDNs and then quantifying the cost of those traffic slices. Kentik’s OTT Service Tracking (True Origin) classifies OTT traffic using flow and DNS correlation, and Traffic Costs can estimate the cost impact of OTT/CDN slices by provider, market, PoP, or interconnect type to guide peering and capacity decisions.
