Cloud Visibility Tools
What is cloud visibility?
Cloud visibility refers to the ability to have a comprehensive view into all the activity within your cloud network. This gives you greater control over your cloud infrastructure so you can monitor cloud security, any performance issues, and optimize cloud costs.
What are cloud visibility tools?
Cloud visibility tools allow IT teams, network engineers, security analysts and other stakeholders to understand what is happening within cloud environments. They allow these teams to monitor, troubleshoot, and optimize their cloud resources within all types of cloud environments and private data centers.
Cloud visibility tools come in many forms. The best ones for you depend on which types of cloud visibility you need, how your cloud environment is configured, and the public cloud being used (AWS, Google Cloud, Azure, etc.).
Kentik in brief: Kentik is a multi-cloud network intelligence platform that delivers end-to-end cloud visibility across AWS, Azure, and Google Cloud, plus the on-prem and Internet paths that connect them. By unifying cloud flow logs and telemetry with routing/topology context, device metrics, and synthetic testing, Kentik makes it easy to map connectivity, pinpoint what changed when performance degrades, and break down cloud egress and data-transfer costs by region, VPC/VNet, gateway, and interconnect.
Learn how AI-powered insights help you predict issues, optimize performance, reduce costs, and enhance security.
Types of cloud visibility tools
General-purpose cloud visibility tools
The most generic category of cloud visibility tool consists of tools offered by cloud providers to help monitor and track their cloud environments. Examples include AWS CloudWatch and Google Cloud’s operation suite (formerly known as Stackdriver).
These tools aren’t designed for a specific type of visibility, like cloud security monitoring or cloud infrastructure monitoring. Instead, they can collect data from all kinds of cloud resources — infrastructure, data centers, SaaS resources, cloud load balancers and so on — to provide a high-level overview of what is happening inside a cloud environment.
Why general-purpose cloud visibility tools fall short in multi-cloud
That said, general-purpose cloud visibility tools typically don’t provide fine-grained context into particular types of issues. For example, they aren’t useful for drilling down and gaining nuanced context on security issues or infrastructure problems.
These tools also usually work only within a given cloud; AWS’s visibility tools only support AWS, for example. That’s a limitation if you use multiple clouds because you won’t be able to monitor all of them with a single cloud provider’s tool.
For both of these reasons, generic visibility tools like CloudWatch are helpful as a starting point for building a complex cloud visibility solution, but they rarely suffice on their own.
In contrast, solutions like Kentik Cloud ingest VPC/VNet flow logs and telemetry from AWS, Azure, Google Cloud and other providers and correlates it with on-prem and Internet traffic so you get a single, end-to-end view of connectivity and performance across your entire hybrid and multi-cloud environment.
Use case-specific visibility tools
Several other types of cloud visibility tools are available that focus on specific use cases.
Multi-cloud visibility
Visibility and observability tools developed by independent vendors offer the ability to monitor multiple cloud environments at once. These tools can usually monitor on-premises infrastructure or private clouds as well. For this reason, IT operations teams often use these types of tools as the basis for tracking a business’s IT estate as a whole.
Network monitoring and observability
To gain deep visibility into the state of cloud networks, you’ll want a network observability tool designed to collect and correlate data from the networks that exist within a single cloud environment and networks that connect different clouds as part of a hybrid or multi-cloud architecture. Below is an example of a network intelligence platform collecting and displaying data in a multi-cloud environment.
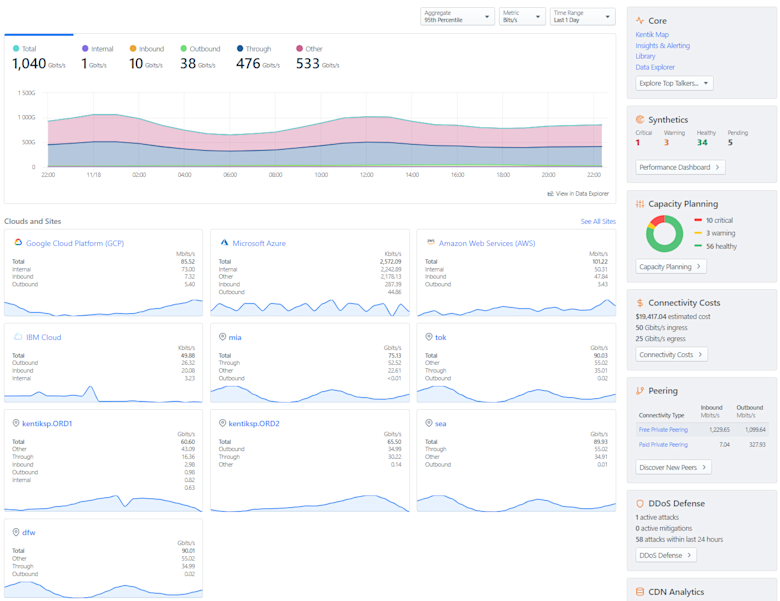
Enterprises can send flow logs and cloud telemetry from AWS, Azure and Google Cloud into Kentik, where it’s normalized into one data model so they can query, alert on and visualize multi-cloud connectivity side-by-side instead of juggling multiple cloud-specific tools.
In this short video, we demonstrate how Kentik provides comprehensive network observability for hybrid cloud environments, encompassing both on-premises and public cloud resources. We start with the Kentik map, showcasing active on-prem sites and cloud environments, then dive into specific examples of how to view and analyze traffic and connectivity:
It’s only by contextualizing networking data that you can gain meaningful insight into complex cloud networks, where traffic constantly moves between clouds and where abstractions like VPCs and software-defined networks can make network visibility particularly challenging.
Security monitoring
Security information and event management (SIEM) and security orchestration, automation and response (SOAR) tools can detect and help manage security risks in the cloud. Security operations teams and analysts typically use them to track the security status of cloud environments. This helps ensure consistent security and compliance standards while eliminating blind spots commonly seen in cloud environments.
Learn how AI-powered insights help you predict issues, optimize performance, reduce costs, and enhance security.

Choosing a cloud visibility tool
When evaluating visibility tools for use in the cloud, consider factors like the following:
- Does the tool work with all public, private, and hybrid clouds you need to support?
- Does the tool help you to analyze data, or is its functionality mainly limited to data collection?
- Can the tool map discrete data sets (such as data from a network switch and data from a public cloud flow log) to provide focused context into complex performance or availability issues? Or does the tool leave it to you to determine relationships between different types of data?
- How is the tool deployed? Does it require agents to be installed across your cloud environments, or can you deploy it automatically, in an agentless way?
- How many cloud resources does the tool consume to run? This is important because tools with high resource consumption may burden your environment and because you’ll pay for the compute and memory resources that the tools consume if you run the tool in the public cloud.
Kentik Solutions for Cloud Visibility
There’s a belief that cloud computing will provide automation and reduce the need for visibility. However, experienced cloud and infrastructure engineers report just the opposite. With the widespread migration of applications and workloads to public clouds, understanding cloud visibility tools is more important than ever.
The Kentik Network Intelligence Platform lets network pros monitor, run, and troubleshoot across on‑prem, WAN/SD‑WAN, and multicloud. Kentik addresses all three pillars of modern network monitoring with traffic visibility, synthetic testing, and Kentik NMS for device/telemetry health. Kentik AI accelerates triage and cause analysis, and Kentik Traffic Costs brings real‑time cost intelligence into day‑to‑day operations.
Kentik offers additional benefits over cloud-specific visibility tools including:
Optimizing cloud egress and reducing unnecessary spend
Kentik breaks down cloud egress by region, VPC, gateway and interconnect so you can see exactly where traffic is leaving your environments; this makes it easy to spot flows hair-pinning through the wrong regions or edges and adjust connectivity or routing policies to move egress to more efficient points.
Finding heavy talkers and noisy neighbors
Kentik lets you break down traffic by VPC, subnet, instance or tag so you can quickly identify heavy talkers or flows that generate disproportionate traffic or egress, which helps reveal noisy neighbors or tenants in shared cloud environments.
Cloud data transfer charges and cost control
By attributing traffic to specific regions, services, gateways and interconnects and tying that back to provider pricing, Kentik shows which flows drive cloud data-transfer charges so you can optimize architecture, move services, or change connectivity and then verify the impact on both traffic and cost.
To see how Kentik can bring the benefits of network intelligence to your organization, request a demo or sign up for a free trial today.
FAQs about Cloud Visibility
How can I get end-to-end visibility across hybrid and multi-cloud networks?
Kentik Cloud gives you end-to-end visibility by ingesting VPC/VNet flow logs and telemetry from AWS, Azure, Google Cloud and more, and correlating that with on-prem, intra-cloud (e.g., VPC-to-VPC, region-to-region), and Internet traffic in one platform. With Kentik Map you can literally see your hybrid topology — data centers, cloud regions, interconnects, and traffic — in a single interactive map, making it easy to trace paths and troubleshoot issues across the entire hybrid/multi-cloud environment.
How do enterprises monitor connectivity across AWS, Azure, and Google Cloud simultaneously?
Enterprises monitor multi-cloud connectivity by normalizing cloud network telemetry (like VPC/VNet flow logs and related metadata) into a single model so teams can query, alert, and dashboard traffic and reachability across providers side-by-side, then pivot from a global view to the exact VPC/VNet/subnet, interconnect, or gateway involved when something breaks. Kentik supports this by unifying multi-cloud telemetry in one platform and pairing it with topology context and cloud connectivity workflows, so teams can troubleshoot cross-cloud issues without switching tools and consoles (See: Multi-Cloud Observability).
How do I monitor cloud gateways, NAT, and load balancers end-to-end?
Monitor gateways and load balancers by tracking which services use which middleboxes, how much traffic traverses them, and whether the path introduces latency, loss, or unexpected cost. Kentik supports this by ingesting cloud flow logs (including gateway and load balancer traffic) and correlating them with topology/routing context so you can see middleboxes in the full end-to-end path and understand their performance and cost impact across hybrid and multi-cloud connectivity. Kentik Map’s Load Balancer details and NAT-focused analytics let you monitor health, throughput, and even cost impact for these components end-to-end — from on-prem through cloud edges and back.
How can I identify suboptimal egress points in multi-cloud architectures?
Identify suboptimal egress by comparing where traffic should exit (closest region, intended gateway, intended interconnect) versus where it actually exits, then flag patterns like unexpected cross-region detours, “wrong-region” internet exits, or traffic pinned to a costly gateway. Kentik supports this with hybrid-cloud traffic and cost views that show egress by region, VPC/VNet, gateway, and interconnect and make it easy to trace which services and flows are responsible, so you can re-route, re-home services, or adjust connectivity to shift traffic to more efficient exits.
How can I identify noisy neighbors in shared cloud infrastructure?
“Noisy neighbors” often show up as disproportionate traffic volume (elephant flows), sudden spikes in east-west chatter, or a tenant/service driving outsized egress that degrades shared capacity. Kentik supports this network-side diagnosis by letting you slice cloud traffic by VPC/VNet, subnet, instance, tag, or tenant to surface the heaviest talkers quickly. If the root cause is host-level contention (CPU/memory/storage) rather than network usage, pair these findings with infrastructure metrics and APM to confirm where the bottleneck actually lives. Those heavy-talker views help you identify noisy neighbors in shared infrastructure — whether that’s a single microservice, a rogue instance, or a particular tenant in a multi-tenant environment.
How can I track and reduce cloud data transfer charges from traffic flows?
Track data transfer charges by attributing traffic to the specific dimensions that trigger billing, such as region, VPC/VNet, subnet, gateway, interconnect, and destination, then isolating the top “cost-driving” flows (cross-AZ, cross-region, internet egress, and provider-to-provider transfers) so you can change architecture or routing and verify the impact. Kentik supports this by ingesting cloud flow logs and enriching them with routing/topology context so you can pinpoint which workloads and paths are generating the transfers, then watch how both traffic patterns and cost drivers change after you move services, adjust routing, or shift connectivity.
How do I monitor inter-availability-zone and inter-region performance?
Kentik ingests region- and AZ-level flow logs so you can chart traffic and performance between availability zones and regions — including latency, volume, and error patterns. For GCP, AWS, and others, Kentik highlights traffic across services like Dedicated Interconnect or Transit Gateway, making it easier to detect when a specific region-pair or AZ-pair is underperforming.
What’s the best way to map and monitor Internet-facing services?
Kentik’s hybrid map and cloud-traffic views make it easy to find and monitor Internet-facing services: you can see which cloud subnets, load balancers, and gateways expose traffic to the public Internet and how those paths run through your interconnects and data centers. Combined with traffic analytics and alerting, that gives you a live map and monitoring framework for every Internet-facing service in your hybrid architecture.
How do I visualize traffic distribution across regions and clouds?
Use a platform that maps your hybrid topology and lets you query traffic by cloud provider and region. Kentik Map visualizes cloud regions and interconnects, while Data Explorer and Insights let you break traffic down by cloud provider/region/subnet to understand distribution across clouds and geographies.
What is the best way to assess cloud egress costs driven by network traffic?
The best approach is to break egress down into “where it exits” (region/AZ, gateway, interconnect, provider edge) and “what drives it” (service, app, tenant, destination), then baseline trends and investigate the deltas when costs spike. Kentik supports this by correlating cloud flow logs with topology and routing context so you can identify high-cost egress paths and the specific flows behind them, which helps NetOps and FinOps teams prioritize the changes that reduce spend without breaking performance.
How do I identify and fix hairpinning in cloud networks?
Hairpinning happens when traffic that should take a short local path instead takes a longer, more expensive detour (often cross-region or out-and-back through a centralized hub), adding latency and driving extra transfer charges. Kentik supports faster detection by surfacing the “who talked to whom” paths (by region/AZ, gateway, and interconnect) from cloud flow logs, so you can spot detours, confirm the specific services involved, then validate the improvement after you localize dependencies, adjust routing, or change the network design.
