How to Meet the Need for APM + NPM
Summary
Integrated application and network observability enables network, SREs, and developer teams to deliver reliable services with great user experience.
In our recent blog post, “The Network Also Needs to be Observable,” we made a case for network observability as an important facet of observability platforms. Here we will dive into the marriage of application and network observability as the means to keep up with today’s “always-great” experience expectations.
Networks are increasingly complex and critical to the success of the applications and services that run on them. Add to that the rise in customer expectations at an all-time high — the network needs to be up, running, and with high performance. Always. Maintaining fast and reliable networks is a must, but also a growing challenge.
As an industry, we started addressing performance at the top of the tech stack:
- Software systems on cloud or cloud platforms
- Applications on containers or container platforms like Rancher or OpenShift
While even business operations have been addressed to improve reliability, interestingly, not enough attention has been given to the network. Yet, small network performance degradations can dismantle user experience, not to mention cause downtime. It is clear: making the network observable has to be part of the solution for providing a great experience.
So what is network observability? The ability to answer any question about your network.
As the industry seeks to address the issues of network complexity, criticality, and customer expectations, at Kentik, we believe the answer is in knowledge: the ability to answer any question about your network, whether corporate, cloud, or internet. Wherever your traffic goes or your data resides, you need to see and know about it. And to achieve that, you need granular, context-rich, comprehensive network telemetry.
Kentik Firehose enables network observability data integration
Kentik Firehose is an essential piece of the APM + NPM puzzle. As Kentik’s streaming API to access enriched network observability data, Kentik Firehose enables organizations to surface network data in traditional observability tools. It also gives organizations the ability to integrate network data in their observability platforms for business and DevOps intelligence.
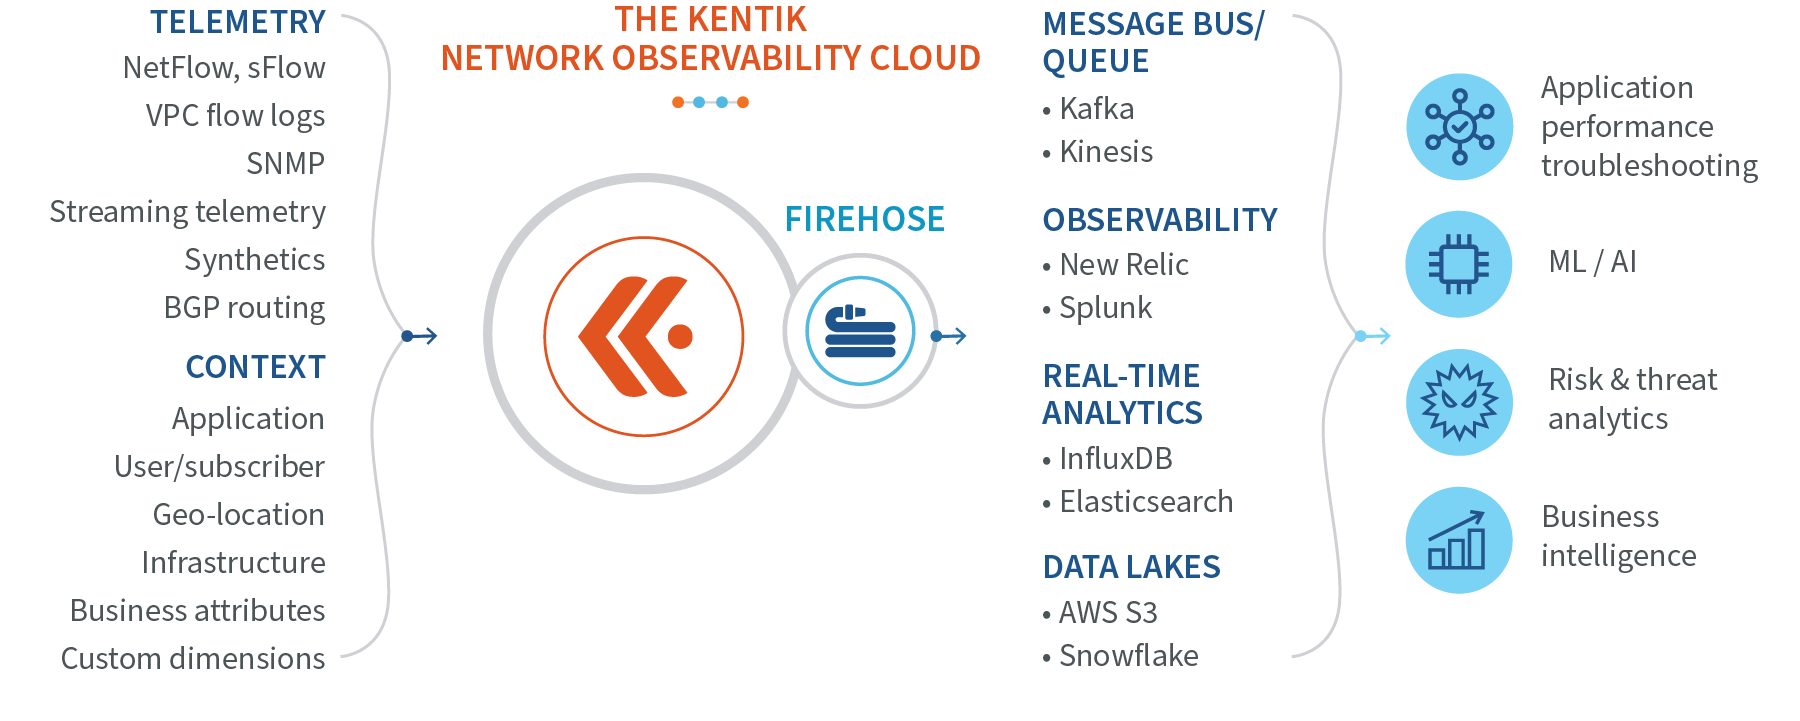
Kentik takes any network telemetry, such as:
- Traditional flow, SNMP, and BGP
- Modern cloud VPC Flow Logs and streaming telemetry
- Host-based packet capture (eBPF for containerized environments)
And enriches that data with context:
- Application
- User
- Geo
- Threat feeds
- Or anything else you could want
And uses it to provide proactive insights, quick answers, and automated workflows.
All of this data gets normalized and stored in our platform, the Kentik Network Observability Platform, where you can ask any questions and get the answers you need about your network, fast! Plus, Kentik does this at scale: At peak load, a Kentik cluster can ingest and enrich 4 million records per second while maintaining sub-second query response times.
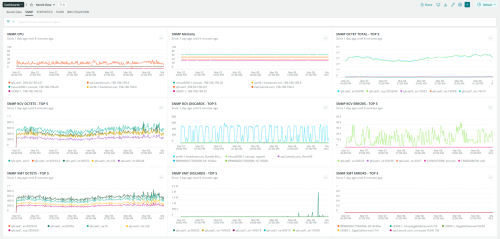
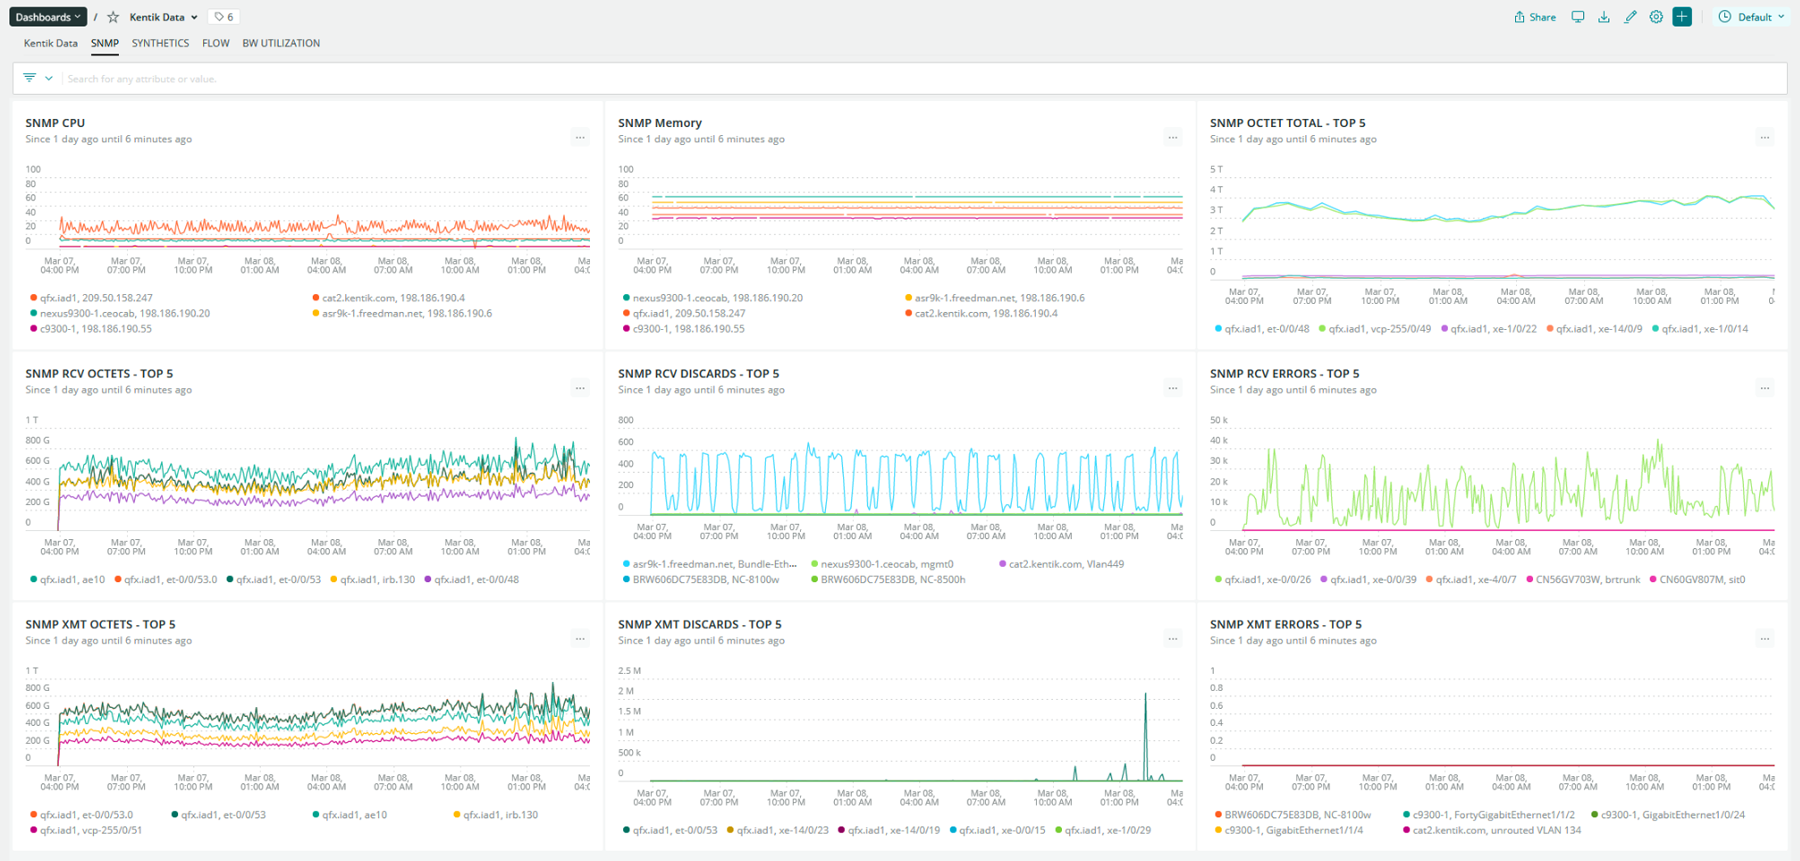
In addition to storing the data for use in Kentik, network observability data can be streamed to additional systems and service endpoints using Kentik Firehose. See below an example of integrated application and network observability with Kentik’s data integrated in New Relic’s dashboards.
NetOps and DevOps Collaboration
One of the key benefits of integrating application and network observability comes to light when NetOps and DevOps teams need to collaborate to geo-locate network issues affecting application performance.
This cross-functional collaboration is crucial in today’s complex application environments with many services and transactions involved in a successful application experience. Success is basically defined in one way: when every part works as expected. But what if that’s not the case? Combinations of possible failing or degrading parts can be overwhelming. Is the network slow somewhere in the path? Or is the problem somewhere in the system or application service components? What if it’s the database that is slow and transactions are queuing up and creating a cascading effect on latency? The reality is that the problem can be anywhere: application, service mesh, API gateway, authentication, Kubernetes, backbone networking, WAN, cloud networking, firewall, etc.
Being able to correlate network data with application and system data leads to a much faster journey to the root cause and resolution.
Use Cases and Benefits Are Limitless
Network observability can be used for performance troubleshooting, capacity planning, security protection, and business analytics. Today’s applications are all digital, and across all networks.
With Kentik Firehose, organizations have full access to network telemetry data to use and extract value in their unique ways, including to:
- Build better products
- Support better workflows
- Implement more reliable automation
- Provide great user experience
The benefits of integrating network observability data into other systems grow with an organization’s vision to use data as a foundation to achieve its goals.
If you are interested in learning more about how to use Kentik Firehose, please check our webinar Enhance Application Performance with Network Observability - Introducing Kentik Firehose.
You can also sign up for early access to New Relic One, Kentik and New Relic’s partnership to deliver network performance telemetry and full network observability.

