How to Boost Revenue and Cut Network Spending with Kentik Traffic Costs

Summary
Network operators across the digital ecosystem are under pressure to cut costs while protecting revenue. This post explores three practical use cases where Kentik Traffic Costs helps turn traffic insight into commercial intelligence that helps teams negotiate smarter, protect margins, and boost profitability.
Earlier this month, we launched Kentik Traffic Costs, the industry’s first traffic-based network cost intelligence workflow. For the first time, operators can see how traffic across their network is driving global connectivity spend – instantly surfacing where dollars are flowing and where margins are at risk.
In this blog post, we unpacked why traffic-based cost intelligence is so critical for service providers and digital enterprises, and why it’s been nearly impossible to solve (until now). And in our launch blog post, we walk through how the Kentik Traffic Costs workflow solves this long-standing problem, step by step, in just a couple of clicks.
Now, let’s dive even deeper with three real-world use cases demonstrating how operators and digital companies across the internet digital supply chain ecosystem are using Traffic Costs to cut costs, boost revenue, and make smarter business decisions.
Use case #1: Customer margin analysis
Arguably, the most powerful application of Traffic Costs is for conducting customer margin analysis, with the ultimate outcome of boosting revenue across the business.
Think about it: how do you know if a particular customer’s traffic is “affordable” or “expensive” to deliver? Without the ability to isolate per-customer traffic and, by extension, calculate per-customer traffic costs, most operators are forced to negotiate blind, relying on gut feel and general market pricing benchmarks. That’s a risky game, as a wrongly negotiated customer renewal could result in highly impactful negative margins for the business.
Let’s take a hypothetical example: a Tier 2 wholesale operator – we’ll name them MarginNet – sells connectivity to hundreds of downstream customers, but also relies on multiple Tier 1 upstream operators for transit to reach the rest of the global internet. Let’s say one of their customers – we’ll call them Canyon Connect – comes up for renewal. They, unsurprisingly, push for a discount at renewal, arguing their current rate of $0.15/Mbps should be lowered to $0.10/Mbps on the grounds that it’s closer to the current market rate. MarginNet’s sales team might feel pressure to concede (hey, that’s the market rate, right?!), but how do you know if your business can actually afford to give that discount?
Here’s the rub: a single customer’s traffic could traverse dozens – or even hundreds – of egress interfaces across your network each month, each with a different cost profile. Untangling that manually is a nightmare, and is exactly why most operators can’t and don’t do this exercise at scale.
With Traffic Costs, MarginNet’s sales and account teams can gain instant access to Canyon Connect’s traffic profile, including the cost MarginNet incurs to serve them, and track costs month over month to determine the effective cost per Mbps. In minutes, they can quickly determine that Canyon Connect’s traffic is actually costing the business $0.25/Mbps to deliver. Suddenly, that “discount” looks more like a margin killer.
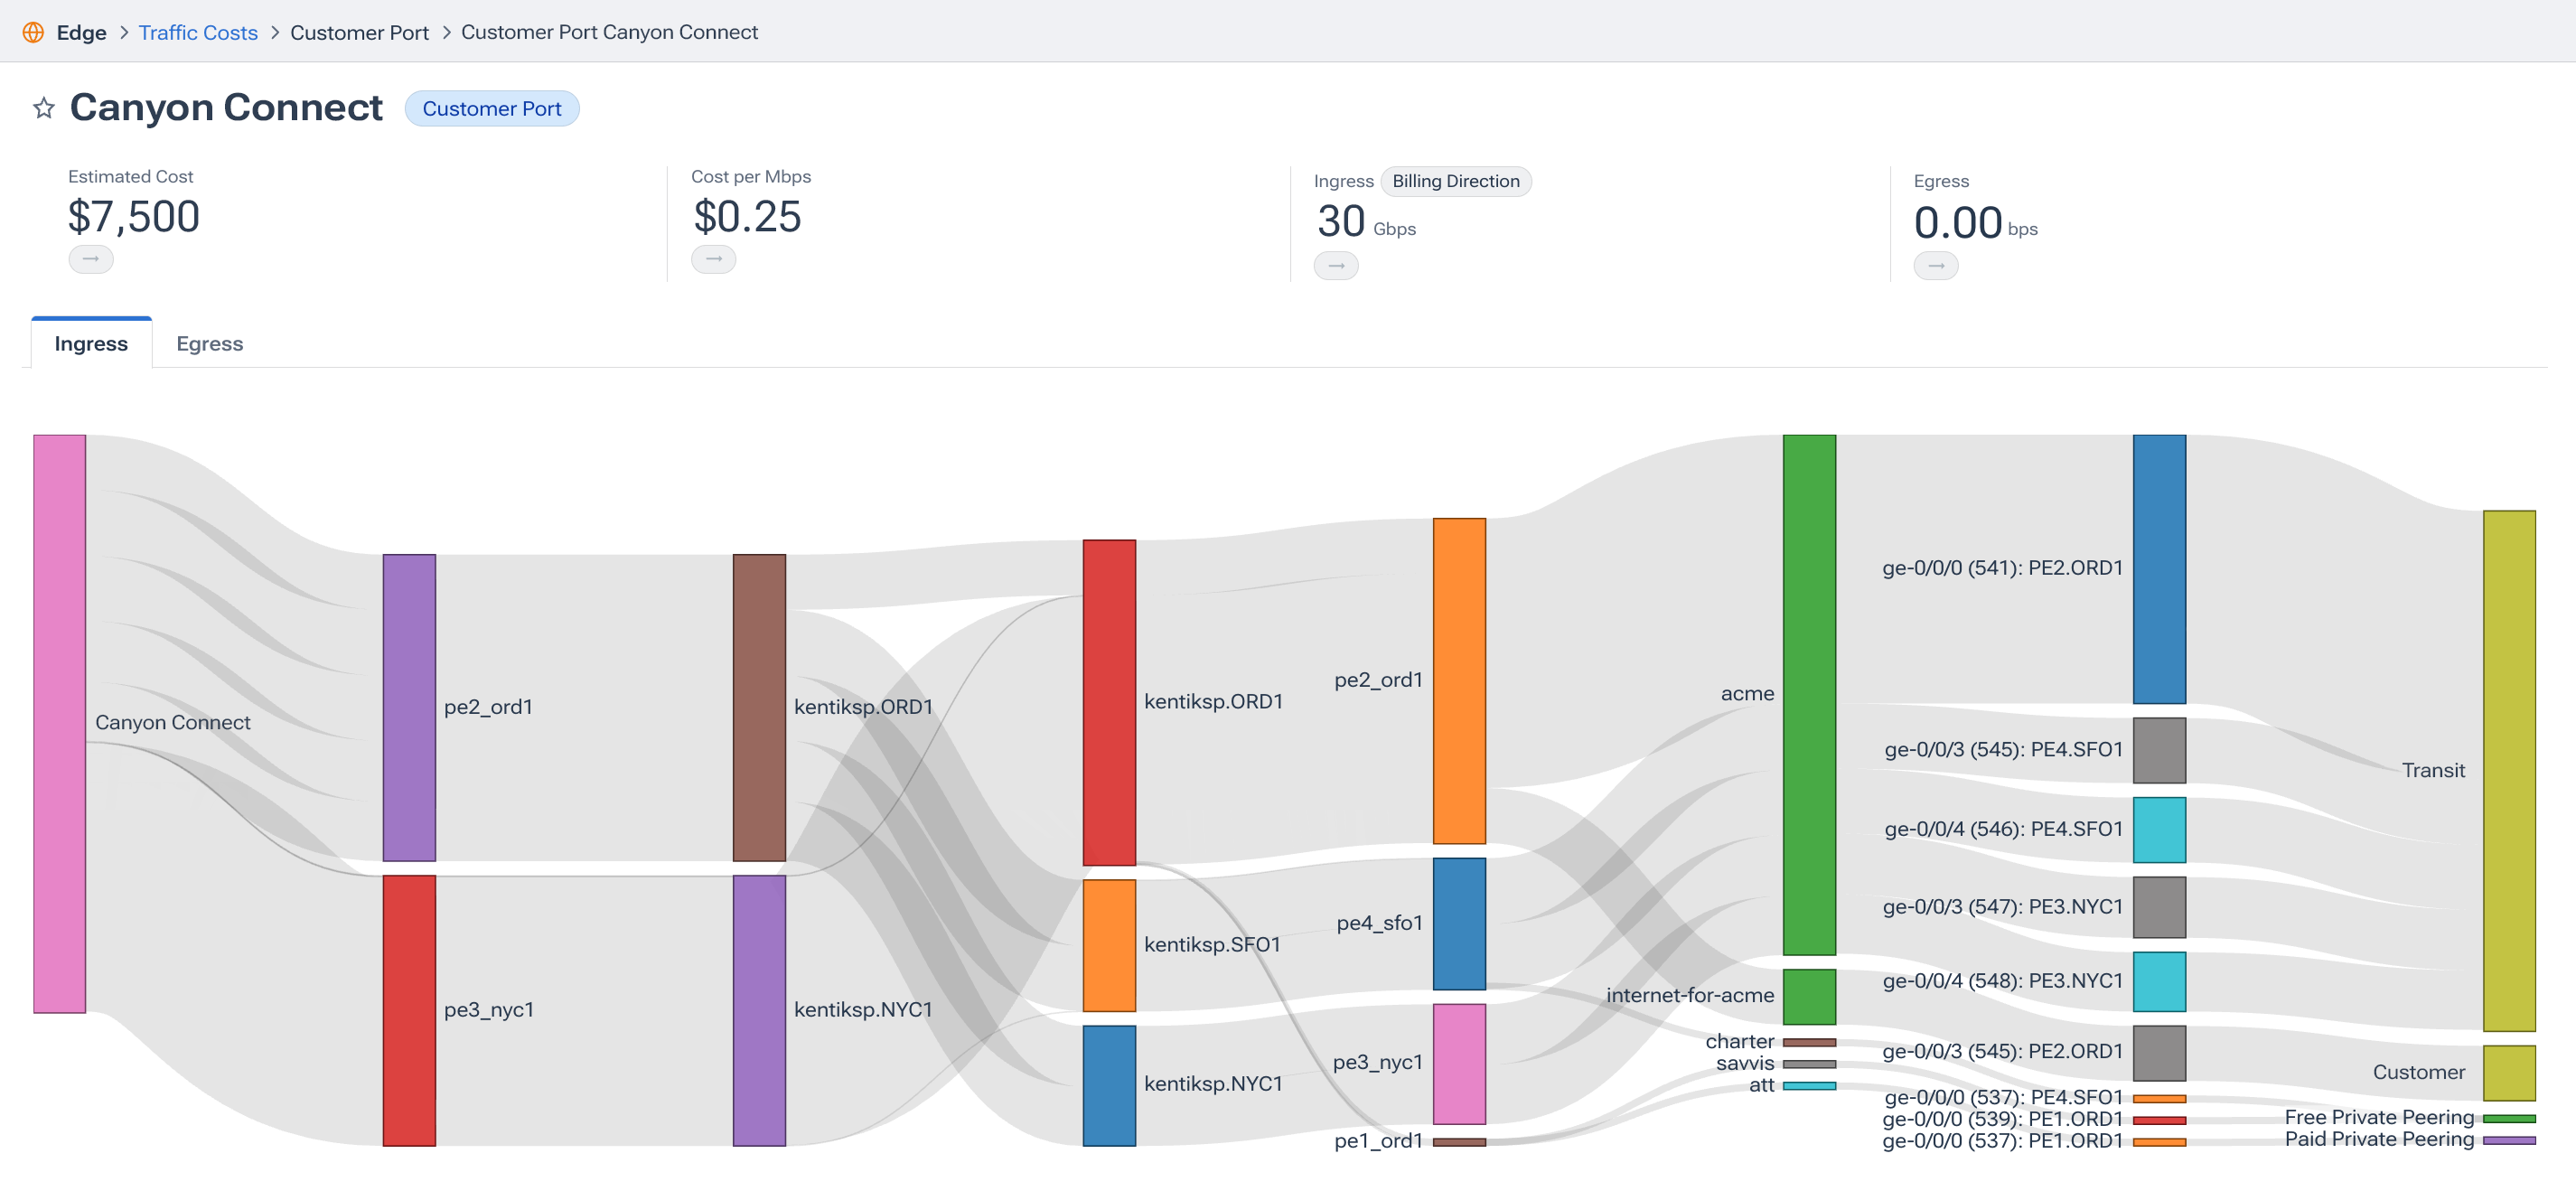
Armed with this data, MarginNet can flip the script: not only refusing the discount, but justifying a rate increase to $0.30/Mbps. That’s the difference between shaky negotiation and a confident one – between shrinking margins and sustainable growth.
Multiply that across every customer, and you’ve got a powerful lever for pricing discipline and long-term profitability.
Use case #2: Costs to serve a geo market or broadband ISP
Let’s flip the perspective to the content and cloud side of the ecosystem – over-the-top (OTT) streaming providers, gaming companies, social platforms, and SaaS giants.
For these companies, the cost vs. performance tradeoff question is never-ending:
- Do we invest in premium connectivity (paid peering, PNI, etc.) in a region to guarantee top performance because the revenue opportunity justifies it?
- Or, do we stick with cheaper transit options because the revenue doesn’t offset the added costs?
That balancing act is exactly where Traffic Costs comes in. With a couple of clicks, a content provider can see how much it costs them to deliver traffic into specific geographies (countries, regions, or cities), destination ASNs, or even down to individual broadband ISPs.
Imagine you’re a streaming company evaluating your costs to serve content to subscribers in California. Subscription growth is booming, so you want to understand costs to serve that region and whether to invest in better connectivity. With Traffic Costs, you can instantly compare how much it costs to deliver traffic into top ISPs across California, or by that particular region/state.
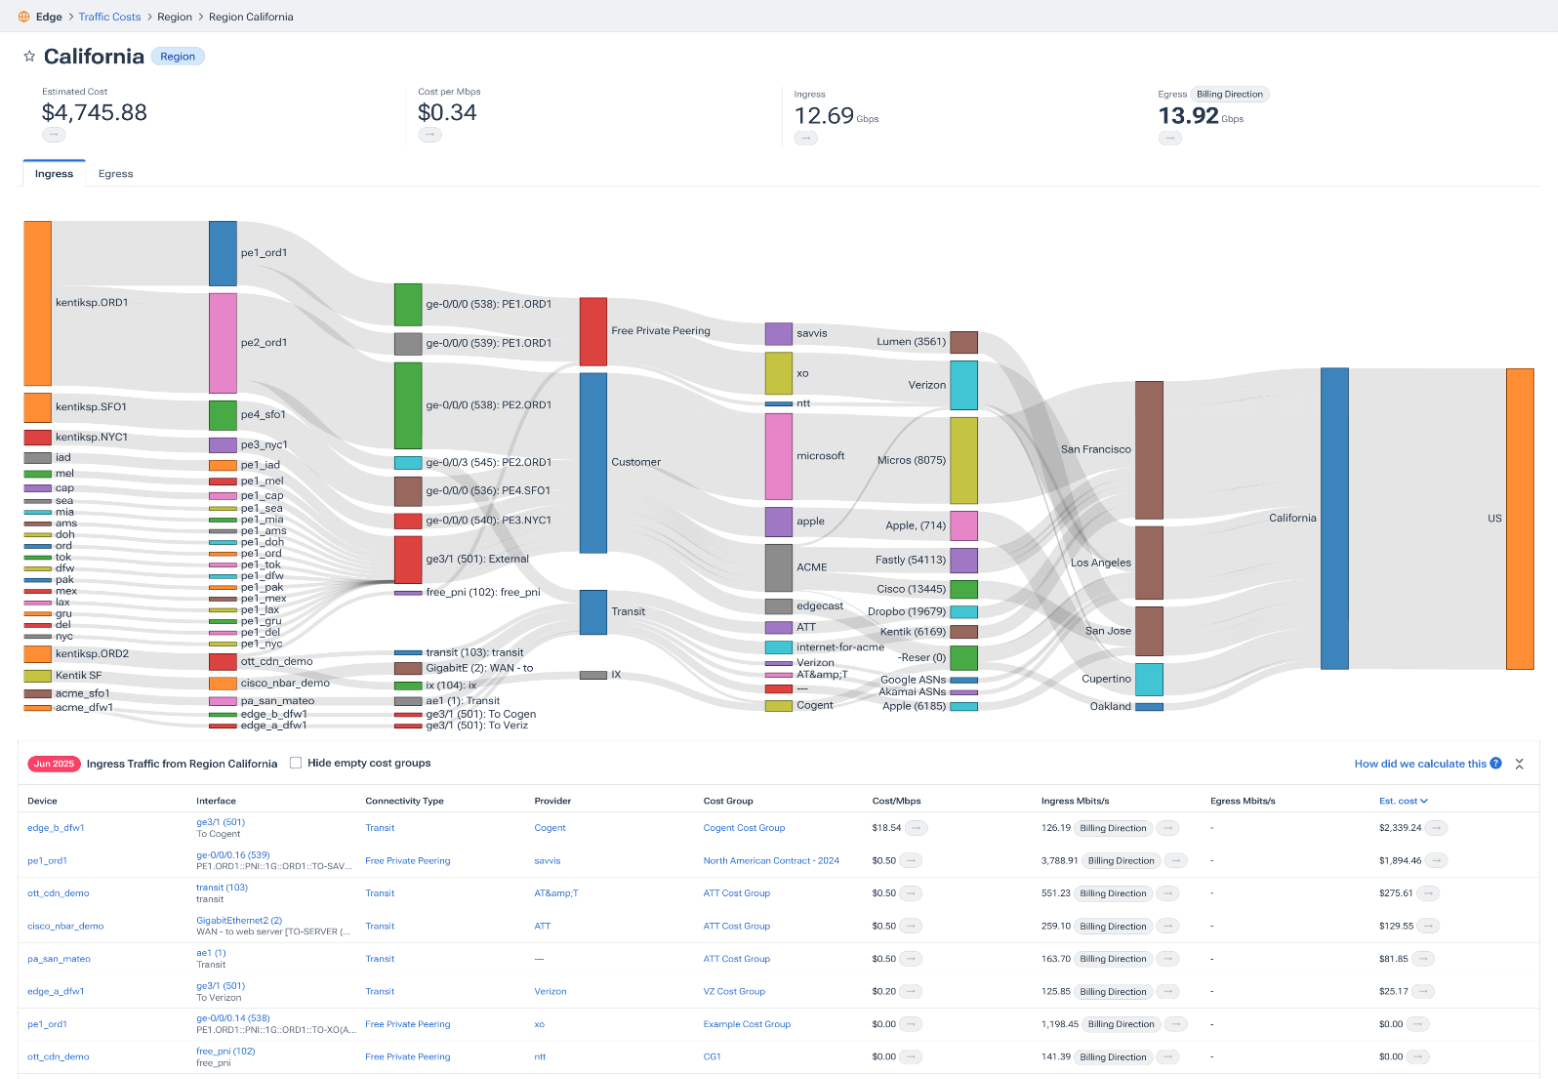
Maybe you discover that one Tier 1 transit path is disproportionately expensive compared to the volume of revenue. That insight drives a new decision: either negotiate better rates with that transit provider, pursue direct connectivity with the broadband ISPs, or re-balance traffic flows to other, cheaper transit providers.
On the flip side, perhaps you see that performance is slipping in a key city or ISP. With Traffic Costs, you can calculate what it currently costs to serve that ISP’s subscribers, then weigh it against your subscription revenue. Suddenly, you have hard data to justify investing in more expensive and/or direct connectivity that will boost the performance and subscriber experience for your content.
The result: financial and engineering teams finally work from the same playbook, making cost-performance decisions that protect both revenue and customer experience.
Use case #3: Understanding costs of subscriber OTT traffic
Finally, let’s zoom back to the internet access and last-mile side of the chain: broadband ISPs and MSOs, the “eyeball networks” that deliver content to millions of end-users and businesses.
For these operators, one of the most significant cost drivers is receiving traffic from CDNs and OTTs (streaming services, gaming, social media, video conferencing, etc.). These services generate a massive share of the traffic their subscribers consume, which in turn drives significant connectivity costs for ISPs.
The challenge? Until now, most ISPs haven’t had clear visibility into which OTTs and CDNs are costing them the most to deliver. Without that view, it’s tough to make smart decisions about peering, interconnection, or traffic engineering.
With Traffic Costs, ISPs can break down costs by source – seeing exactly how much it’s costing them to deliver Netflix vs. YouTube vs. Twitch vs. Meta traffic into their subscriber base. This insight is invaluable for:
- Negotiating peering and interconnection agreements: If a particular OTT is disproportionately expensive, you can take that data into commercial negotiations.
- Deciding where to deploy local cache nodes: Reduce transit spend and improve performance by keeping popular content closer to subscribers.
- Optimizing traffic engineering: Route OTT traffic more cost-effectively without sacrificing user experience.
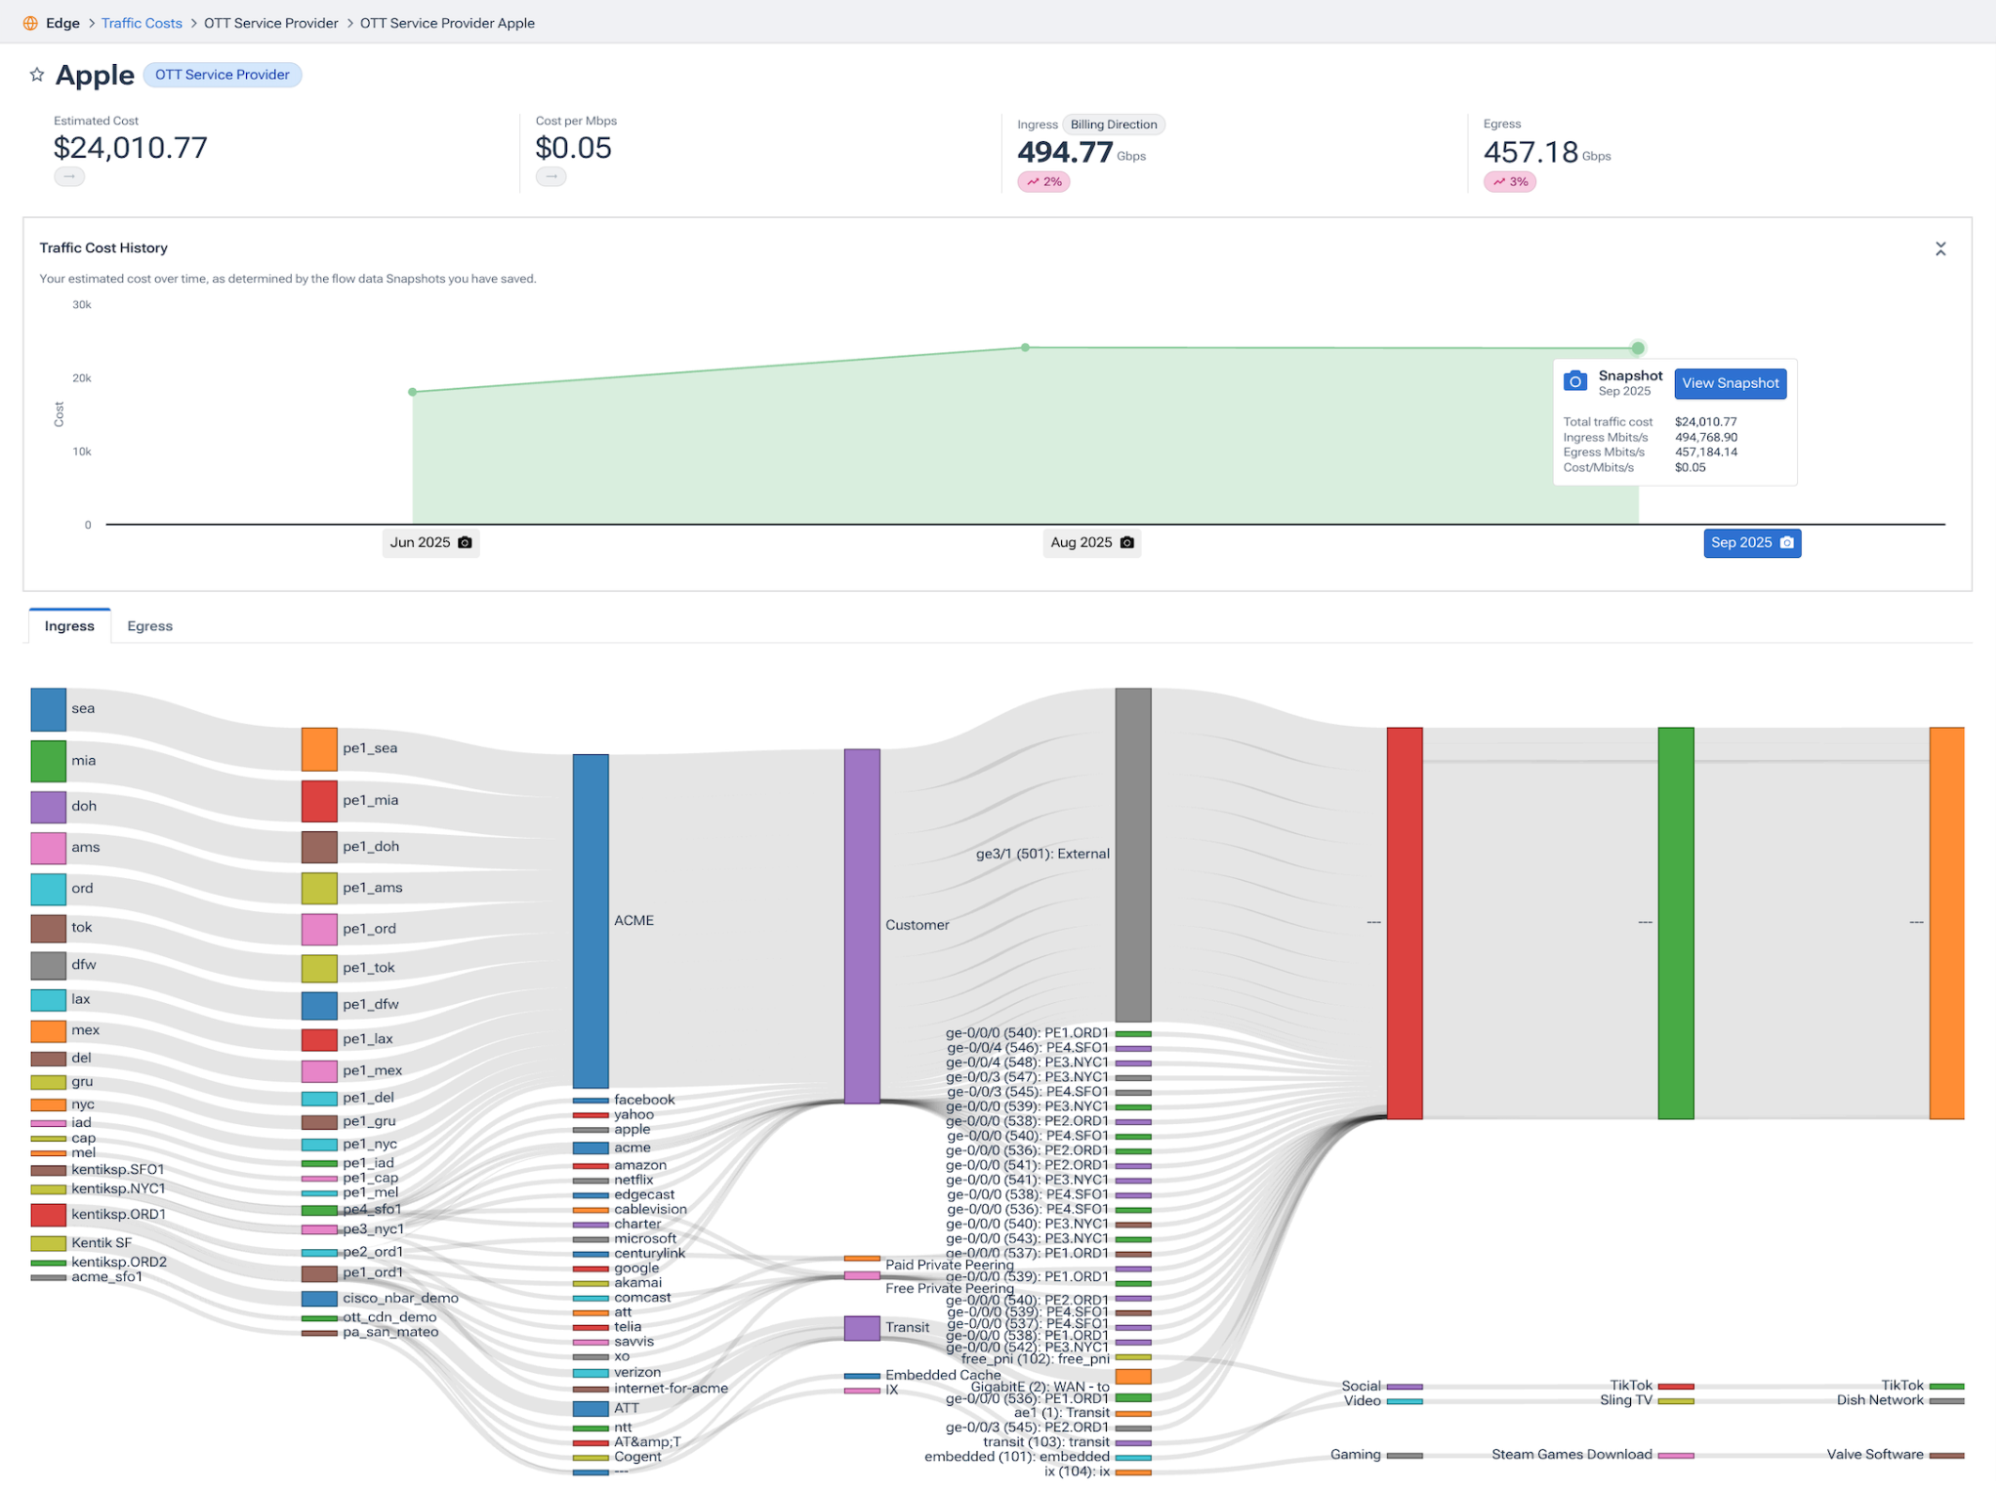
In short: Broadband ISPs no longer have to guess. With Traffic Costs, they can quantify which OTTs are driving the costs, then optimize how that traffic enters their network – cutting spend while also improving subscriber satisfaction.
“By integrating Traffic Costs into our network operations we’ve gained unprecedented visibility into the actual input costs of our connectivity services. This level of insight allows us to continuously optimize our network spend, identifying cost anomalies, validating supplier invoices, and making smarter peering and transit decisions.”
– Callum Barr, Principal Network ArchitectReady to see Traffic Costs in action?
Check out our demo video, then sign up for a personalized Kentik demo to see how Traffic Costs can help you cut costs, boost margins, and make smarter network decisions.

