NMS Migration Made Easy: Moving Foward with Kentik NMS

Summary
The time has come to switch to your new network monitoring solution. Remember, if an alert, report, ticket, or notification does not spark joy, get rid of it. We’ll cover how to spin up Kentik NMS and ensure you’re ready to sunset your old solution for good.
I’m back again with another step in the journey from your old monitoring solution to Kentik NMS. Previously, I discussed the information you need to gather in preparation for the big move and how you can get the rest of the organization on board. In this post, I’m going to dig into what it looks like when Kentik NMS comes fully online and how you know when it’s safe to turn off the old technology.
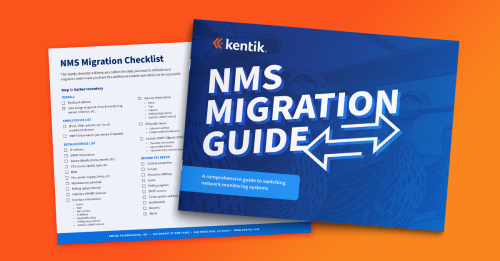
Of course, if you want to get the complete 33-page story all at once, you can always download the NMS Migration Guide.
But you’re already here, just one sentence away from network observability triumph. You might as well read on and bask in the glory.
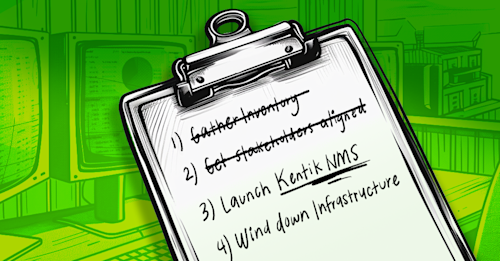
Step 3: Launch the alternative (Kentik. Duh.)

You got the inventory. You got the buy-in. Now it’s time to get to work.
Installing NMS is reasonably trivial – it’s a single curl command or Docker run statement. So much so that we won’t chew up space here going over it.
Instead, we will wave our magic wand and say you have Kentik installed and your devices (whether it’s a sample representation or your whole environment) loaded up and sending data.
Now what? How do you validate that you’re collecting everything you need and are ready to move forward in the migration?
For starters, plan to run in parallel for some time. How long it will take depends on your environment’s size, complexity, and organizational risk tolerance. Some folks run parallel for a week or two, and others keep it going much longer.
Because SNMP and streaming telemetry create such a slight drag, pulling the same data into two systems is usually fine.
What can be an issue are integrated tools like ticketing systems, email queues, and chat-ops. Nobody wants double tickets, emails, or pop-ups.
Therefore, we recommend outputting one or the other system to a centralized log or even a shared email box. One system will still be responsible for cutting tickets, sending out notifications, etc. The other will output the information it would be sending to those targets to validate there’s been no loss of signal or fidelity (either by checking message by message or as a daily or weekly side-by-side comparison). Once apples-to-apples has been confirmed, the switch for that system (email, tickets, etc.) can be made, sending the old system to log file for validation and sending from Kentik NMS to the real destination.
This phase of the process also presents opportunities and risks that many organizations need to expect and thus are caught short.
It’s a time of opportunity because, even though you want to validate like-for-like, there’s every chance that when you review specific messages, ticket types, and so on, you (collectively, as a team) will realize it’s no longer needed. You should wholeheartedly embrace this opportunity to simplify. If an alert, report, ticket, or notification does not spark joy, get rid of it.
That points to the inherent risk. As you validate those outbound messages and connections, it’s incredibly easy to fall into the trap of “fixing” them—adding functionality or elements they didn’t initially have. While some tweaking is unavoidable, try to minimize this as much as possible. You have plenty on your plate with the migration itself.
Feel free to log what enhancement requests and bug fixes are, and plan to return to that list once the migration is complete.
Finally, this is a moment when you can leverage another aspect of Kentik’s platform: Query Assistant and Journeys.
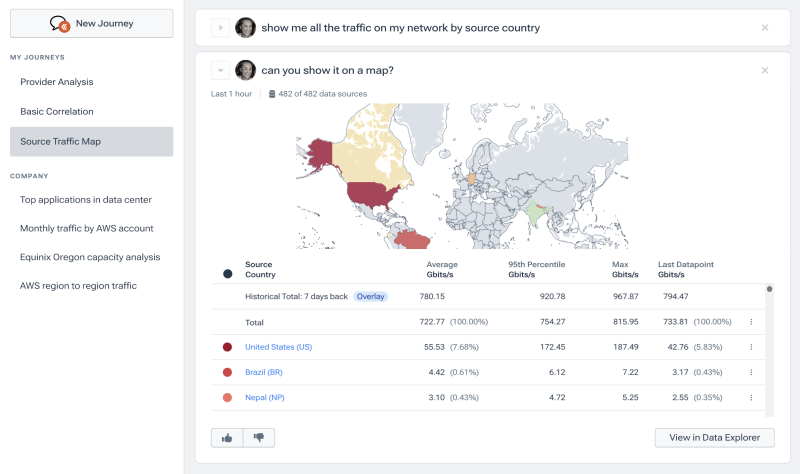
We know it’s hard to get through a random 15 minutes without some marketing type popping out of your screen shouting about AI, LLMs, and Chat-jippity (yes, that is how you pronounce it).
That said, Kentik has integrated a dedicated LLM that is custom-trained to respond to questions and language relating to network monitoring and observability. If you struggle to get Kentik NMS to show you the same data you are used to seeing in the old system, you have an “easy button” in the form of the Query Assistant and Journeys. Ask, and ye shall receive.
Believe it or not, that’s all we have to say about this step. A lot of the work involved here is self-evident. So get to work, and know we’re here to help if needed.
Step 4: Wind down infrastructure
In our hypothetical scenario, by this point, things are working well! Maybe even better than that! You’re comfortable enough with the data coming out of Kentik that all external integrations have been cut over, and your old solution is in the corner, muttering output into a glass of log files and wondering where they went wrong.
There comes a point when everyone can agree it’s no longer necessary to maintain the facade that the old monitoring tool matters. Not only that, but the ongoing cost of upkeep—the license for the tool, the operating system, the database, and such—is a drag on the budget.
Take one more backup of the data – in the case of SolarWinds, that’s the SQL database, but for other tools, it’s whatever your old monitoring solution kept its up-to-the-minute metrics. You should only need to back up some of the other items and elements we listed in Step 1 since you’ve replicated it all in Kentik NMS by this point.
Once that’s done, maybe get the team together to raise a glass to mark the occasion—this liminal moment between the tired old monitoring tool that was good for its time but couldn’t keep up—and the bright new future where the necessary bases (like SNMP) are covered, and new capabilities (like streaming telemetry) are to be explored.

Okay, poetic faffing about aside, what do you need to actually do? For starters, “follow the money.”
What we mean is, look at the elements of the old monitoring solution you continue to pay for – are there one or more servers in a rack somewhere still under maintenance? Indeed, there are payments for the tool itself. Then, there are the previously mentioned OS and database licenses.
Ensure you have a handle on all those things, as well as license keys, vendor IDs, etc., or else you may find yourself making an unwanted trip into the data center to restart a server where you thought you’d typed “shutdown /s” for the last time.
Speaking of the data center, work with them to understand the physical connections to your on-prem equipment. Reclaiming switch ports is serious business.
To be honest, untangling years of infrastructure investment shouldn’t take all that long, but without awareness and planning, it can drag on for way longer than necessary and distract you from the other essential tasks on your plate.
Once this is done, you’re well and truly finished from a technical standpoint. But as Roz from “Monsters, Inc.” would remind you, don’t forget to do the paperwork. That means notifying your purchasing folks and letting them know they should not renew the contract with your old monitoring tool vendor. Then be a stand-up customer (not to mention a mentsch): Pick up the phone and have a necessary (but understandably hard) conversation with your sales rep from the old vendor to let them know you won’t be continuing the contract. Sure, it will be uncomfortable, but it’s the right thing to do.
Conclusion: Life, love, and network observability
This may be the end of this post, but it represents the beginning of the rest of our journey. Network monitoring is an old topic – spanning at least 30 years to the inception of SNMP itself. However, despite a full field of solutions, Kentik decided to build and launch NMS specifically because the older tools still needed to keep up with newer technologies, realities, and paradigms that make up modern networks.
While the focus within this series has been to take what you had (primarily reliant on ping and SNMP) and move it over, the truth is that new technologies like streaming telemetry will provide you with vastly more meaningful insights and results.
Equally important are capabilities within the broader Kentik platform – NetFlow is neither novel nor new, but its value is difficult to overstate. The same can be said for synthetics, VPC flow log insights, Kubernetes monitoring, DDoS detection and mitigation, botnet discovery, and all of the other benefits, large and small, that come as part of the Kentik platform.
So it turns out that was just a little bit of a marketing-laden teaser. But if you’ve read this far, you’re probably on board for the whole ride.
And we appreciate your willingness to see this through to the end. Here at Kentik, we know you have a lot of demands for your attention. We hope the time you’ve spent with us was valuable to you – that we’ve not only answered the questions you had when you began reading but have also raised new ideas you hadn’t even considered and shown you some new techniques along the way.
Have I left anything out?
We’ve come to the end of our migration journey. Certainly, what you see above is the end of the migration guide. But I think I have one more bit of insight for the stalwart IT practitioner. If you’re up to it, tune in next week for a final thought.
Until then, may your packets flow and all your routes be solidly deterministic.
